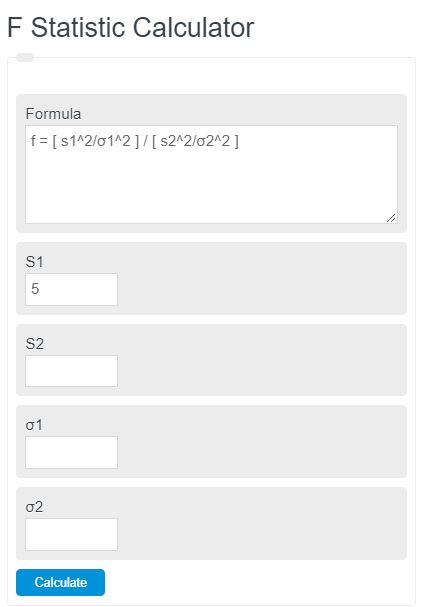
Enter the standard deviation of a population and sample of two different sets of information into the calculator. The calculator will evaluate the f statistic, also known as the f value.
- Standard Normal Distribution Calculator
- T Statistic Calculator
- Central Limit Theorem Calculator
- Statistical Significance Calculator
F Statistic Formula
The following equation can be used to calculate the f-value of two sets of data.
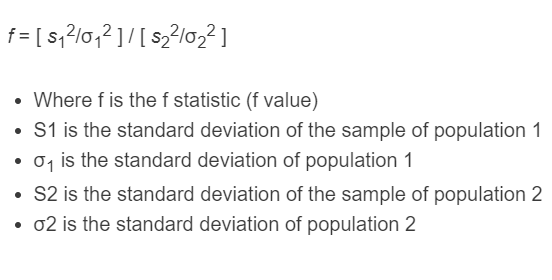
f = [ s_1^2/σ_1^2 ] / [ s_2^2/σ_2^2 ]
- Where f is the f statistic (f value)
- S1 is the standard deviation of the sample of population 1
- σ1 is the standard deviation of population 1
- S2 is the standard deviation of the sample of population 2
- σ2 is the standard deviation of population 2
F Statistic Definition
The F-statistic is a statistical measure used to compare the variances between two or more groups. It determines whether the differences observed between the group means are statistically significant or simply due to chance. This is important because it helps us understand if there are true differences between groups, allowing for more confident conclusions and informed decision-making.
F Statistic Example
How to calculate an f statistic
- First, determine the standard deviations of the populations
Calculate the standard deviations of both populations of data.
- Next, determine the standard deviations of the samples
Take 1 sample set from each population and calculate their standard deviations.
- Calculate the F Statistic
Enter the standard deviations from steps 1 and 2 into the equation presented above to calculate the f value.
FAQ
Why is the F Statistic important in statistical analysis?The F Statistic is crucial because it allows researchers to test hypotheses about the equality of variances across different groups. This helps in determining if the observed differences in means are statistically significant, aiding in the validation of research findings.
How does the F Statistic differ from the T Statistic?While the F Statistic is used to compare variances between two or more groups, the T Statistic is used to compare the means between two groups. Essentially, the F test is for variance analysis in ANOVA, whereas the T test is for mean analysis in simpler comparison studies.
Can the F Statistic be used for more than two groups?Yes, the F Statistic is particularly useful in ANOVA (Analysis of Variance) where it is used to compare the variances of three or more groups to find out if at least one of the group means significantly differs from the others.
What does a high F value indicate in the context of an F test?A high F value typically indicates that there are significant differences among group variances being tested. It suggests that at least one of the group means is significantly different from the others, leading to the rejection of the null hypothesis of equal variances.