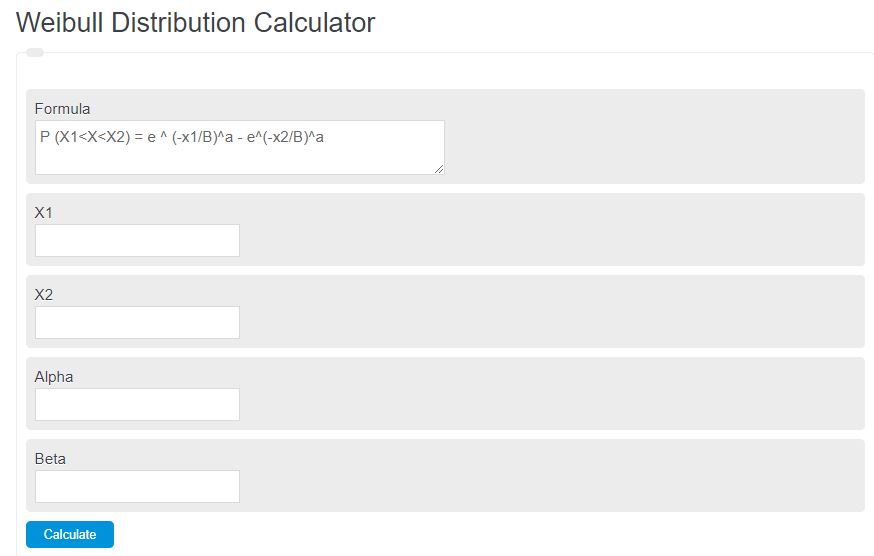
Enter alpha, beta, x1, and x2 into the calculator to determine the Weibull distribution of the function.
- Standard Normal Distribution Calculator
- Relative Standard Deviation Calculator
- Empirical Rule Calculator (68%, 95%, 99.7%)
Weibull Distribution Formula
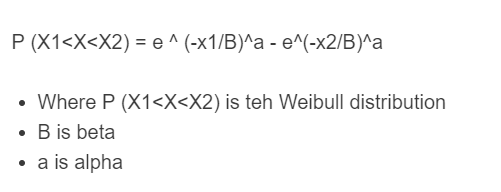
The following formula is used to calculate a Weibull distribution/probability of a function.
P (X1<X<X2) = e ^ (-x1/B)^a – e^(-x2/B)^a
- Where P (X1<X<X2) is the Weibull distribution
- B is beta
- a is alpha
Weibull Distribution Definition
The Weibull distribution is a statistical probability distribution widely used in various fields to model the time until a specific event occurs. It is named after the Swedish engineer Waloddi Weibull, who introduced it in the 1950s.
The key characteristic of the Weibull distribution is its flexibility in capturing a wide range of shapes, making it applicable to a diverse range of data patterns.
It is commonly used to analyze failure times or lifetimes of products and systems, such as the time until a machine breaks down or the lifespan of a particular component.
What distinguishes the Weibull distribution from other probability distributions is its ability to capture different types of failure patterns. It can represent a variety of shapes, including decreasing, constant, or increasing failure rates.
This flexibility allows for a more accurate representation of real-world data, as failures in the real world do not always follow a specific pattern.
The Weibull distribution is particularly important because it provides valuable insights into the reliability and survival analysis of various systems.
By estimating the parameters of the distribution from observed data, analysts can determine the failure rate over time, calculate the probability of failure within a given timeframe, and evaluate the reliability of a system or product.
Weibull Distribution Example
How to calculate Weibull distribution?
- First, determine the two points.
Determine the two points, X1 and X2, that you want to know the probability of the function falling in between them.
- Next, determine the alpha.
Calculate alpha of the function.
- Next, determine the beta.
Calculate the beta of the function.
- Finally, calculate the Weibull Distribution.
Using the formula above, calculate the Weibull Distribution.
FAQ
What is the significance of the alpha and beta parameters in the Weibull distribution?
Alpha (a) represents the shape parameter of the distribution, which determines the failure rate’s behavior over time, while beta (B) is the scale parameter that defines the scale of the distribution, affecting the spread of data points.
How does the Weibull distribution differ from other statistical distributions?
The Weibull distribution is unique due to its flexibility in modeling different types of data patterns, including increasing, constant, or decreasing failure rates, making it more adaptable to real-world data than many other distributions.
Why is the Weibull distribution important for reliability analysis?
The Weibull distribution is crucial for reliability analysis because it allows for an accurate assessment of the time until failure for products or systems. This helps in planning maintenance, improving designs, and ensuring the reliability of systems over time.
Can the Weibull distribution be used for predicting future events?
Yes, by fitting the Weibull distribution to historical data and estimating its parameters, analysts can predict the probability of future failures or events within a given timeframe, aiding in proactive decision-making and risk management.