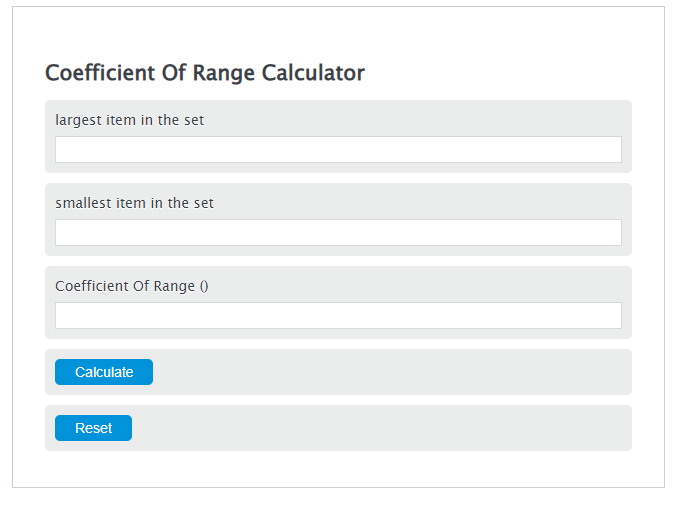
Enter the largest item in the set and the smallest item in the set into the Calculator. The calculator will evaluate the Coefficient Of Range.
Coefficient Of Range Formula
COR = (L -S) / (L+S)
Variables:
- COR is the Coefficient Of Range ()
- L is the largest item in the set
- S is the smallest item in the set
To calculate Coefficient Of Range, divide the difference between the largest and smallest items in the set by the sum of those items.
How to Calculate Coefficient Of Range?
The following steps outline how to calculate the Coefficient Of Range.
- First, determine the largest item in the set.
- Next, determine the smallest item in the set.
- Next, gather the formula from above = COR = (L –S) / (L+S).
- Finally, calculate the Coefficient Of Range.
- After inserting the variables and calculating the result, check your answer with the calculator above.
Example Problem :
Use the following variables as an example problem to test your knowledge.
largest item in the set = 35
smallest item in the set = 17
FAQs
What does the Coefficient Of Range tell us about a data set?
The Coefficient Of Range provides a measure of the relative variability of the data set. It indicates how spread out the values are, relative to the size of the set. A higher coefficient suggests a greater range of values.
Why is it important to calculate the Coefficient Of Range?
Calculating the Coefficient Of Range is important for understanding the dispersion within a set of data. It helps in comparing the variability of different data sets, even if they have different scales.
Can the Coefficient Of Range be negative?
No, the Coefficient Of Range cannot be negative. Since it is calculated as the difference between the largest and smallest values divided by the sum of those values, the result is always non-negative.
How does the Coefficient Of Range compare to other measures of dispersion?
The Coefficient Of Range is a simple measure of dispersion that only takes into account the range of the data. It does not provide information about the distribution of values within the set. Other measures, like standard deviation and variance, offer more detailed insights into the data’s variability.