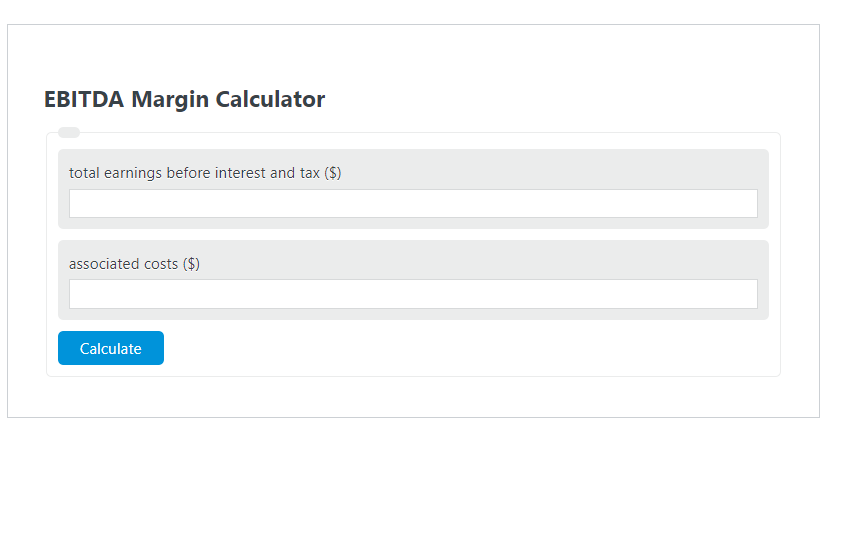
Enter the total earnings before interest and tax ($) and the total associated costs ($) into the EBITDA Margin Calculator. The calculator will evaluate and display the EBITDA Margin.
EBITDA Margin Formula
The following formula is used to calculate the EBITDA Margin.
EM = (EBITDA - AC) / EBITDA * 100
- Where EM is the EBITDA Margin (%)
- EBITDA is the total earnings before interest and tax ($)
- AC is the total associated costs ($)
How to Calculate EBITDA Margin?
The following example problems outline how to calculate EBITDA Margin.
Example Problem #1:
- First, determine the total earnings before interest and tax ($).
- The total earnings before interest and tax ($) is given as: 134.
- Next, determine the total associated costs ($).
- The total associated costs ($) is provided as: 50.
- Finally, calculate the EBITDA Margin using the equation above:
EM = (EBITDA – AC) / EBITDA * 100
The values given above are inserted into the equation below and the solution is calculated:
EM = (134 – 50) / 134* 100 = 62.68 (%)
FAQ
What is EBITDA and why is it important?
EBITDA stands for Earnings Before Interest, Taxes, Depreciation, and Amortization. It’s a measure used to evaluate a company’s operating performance. It’s important because it removes the effects of financing and accounting decisions, providing a clearer view of a company’s operational profitability and cash flow.
How can the EBITDA Margin help investors?
The EBITDA Margin, expressed as a percentage, shows how much operating cash flow a company generates as a proportion of its revenue. It helps investors assess the financial health and efficiency of a company, comparing profitability among companies and industries by eliminating the effects of financing and accounting decisions.
Are there any limitations to using EBITDA Margin as a financial metric?
Yes, there are limitations. While EBITDA Margin can provide valuable insights into a company’s operational efficiency, it does not account for the cost of capital investments like property, plant, and equipment. This can sometimes give an inflated view of a company’s financial health, especially for capital-intensive industries. Additionally, it ignores changes in working capital and cash flow timing differences.
