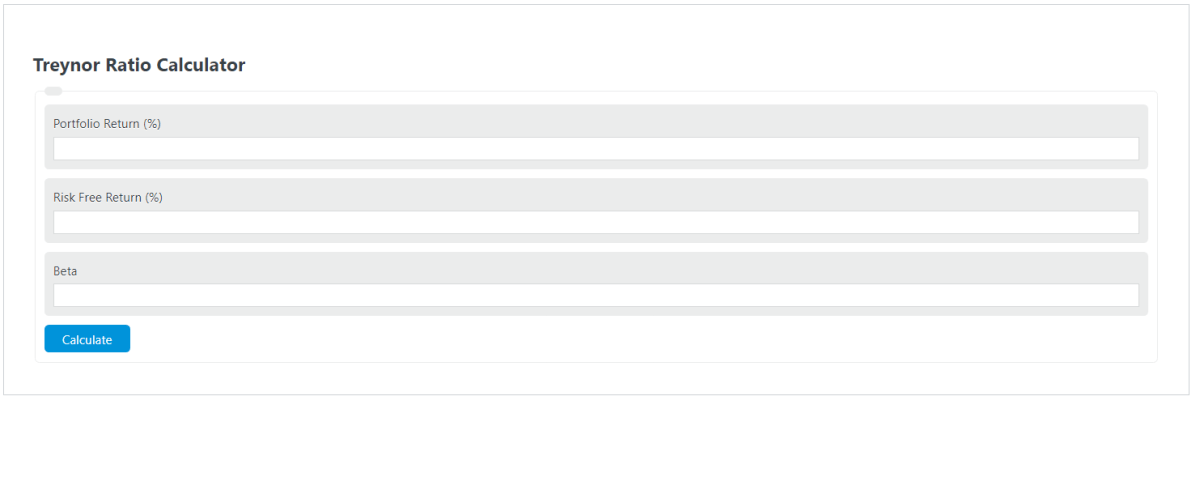
Enter the percentage return of the portfolio, the beta of the portfolio, and the risk-free return into the calculator to determine the Treynor ratio.
- Risk-Adjusted Return Calculator
- Risk Premium Calculator
- Beta Portfolio Calculator
- Sharpe Ratio Calculator
Treynor Ratio Formula
The following formula is used to calculate a Treynor Ratio:
TR = (PR - RFR) / B
- Where TR is the Treynor ratio
- PR is the portfolio return (%)
- RFR is the risk-free return (%)
- B is the portfolio beta
To calculate the Treynor ratio, subtract the risk-free return from the portfolio return, then divide it by the portfolio beta.
What is the Treynor ratio?
A Treynor ratio measures the excess return a given portfolio achieved per unit of risk the portfolio takes.
In other words, the Treynor ratio is the reward-to-volatility ratio. The risk in the case of this formula is determined by the portfolio’s beta. Determining the beta can be explored with the calculator linked above.
How to calculate Treynor ratio?
The following example outlines the information and steps needed to calculate a Treynor ratio.
First, determine the total percentage return of the portfolio. For this example, the portfolio has returned 12%.
Next, determine the return of a risk-free asset. For this example, we will use a risk-free rate of 2%.
Next, determine the beta. The beta for this particular portfolio is measured to be 1.36.
Finally, calculate the Treynor ratio using the formula above:
TR = (PR – RFR) / B
TR = (12 – 2) / 1.36
TR = 7.35%
FAQ
What is the importance of the Treynor Ratio in investment analysis?
The Treynor Ratio is crucial in investment analysis because it provides investors with insight into the risk-adjusted return of a portfolio. It helps in comparing the performance of different portfolios by evaluating how much excess return is generated for each unit of risk taken, allowing investors to make more informed decisions.
How does the Treynor Ratio differ from the Sharpe Ratio?
While both the Treynor and Sharpe ratios measure the risk-adjusted return of an investment, they differ in the risk measure used. The Treynor Ratio uses beta, which measures a portfolio’s volatility relative to the market, as its risk measure. In contrast, the Sharpe Ratio uses standard deviation, which measures the total volatility of the portfolio, as its risk measure. This difference makes the Treynor Ratio more suitable for diversified portfolios, while the Sharpe Ratio is applicable to both diversified and non-diversified portfolios.
Can the Treynor Ratio be negative? What does it imply?
Yes, the Treynor Ratio can be negative. A negative Treynor Ratio implies that the portfolio’s return is less than the risk-free rate of return, indicating that the investment has underperformed on a risk-adjusted basis. It suggests that the investor would have been better off investing in risk-free securities instead of taking on the additional risk associated with the portfolio.
