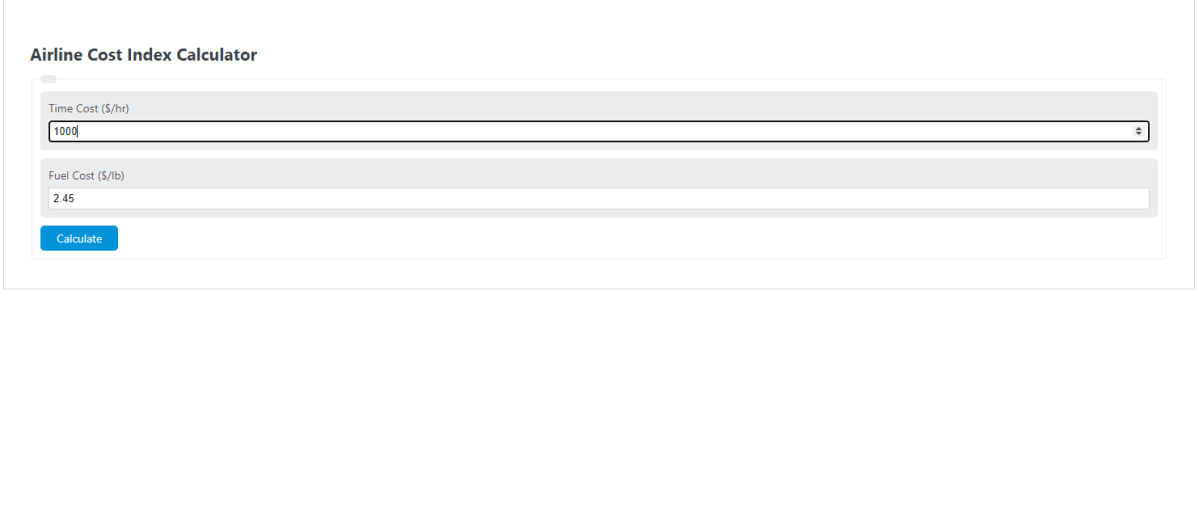
Calculate airline cost index from time-related cost and Jet-A fuel price, or find the implied hourly time cost from a given CI and fuel price.
Airline Cost Index Formula
The following formula is used to calculate an airline cost index.
- Where ACI is the airline cost index
- TCT is the total cost of time ($/hr)
- TCF is the total cost of fuel ($/lb)
To calculate the airline cost index, divide the total cost of time by the total cost of fuel.
What Is an Airline Cost Index?
An airline cost index (CI) is a numerical ratio that expresses the relationship between an airline’s time-related operating costs and its fuel costs. It is the primary parameter entered into a flight management system (FMS) or flight management computer (FMC) to determine the most economical speed and altitude profile for each phase of flight. The CI tells the aircraft’s onboard computers how much weight to give to saving time versus saving fuel when computing climb speeds, cruise speeds, cruise altitude, and descent profiles.
When the CI is set to zero, the FMS treats fuel as infinitely expensive relative to time. The aircraft will fly at its maximum range cruise (MRC) speed, climb at the best rate of climb airspeed, cruise at the highest practical altitude, begin descent later, and descend at slower speeds. The result is minimum fuel burn for the trip, at the expense of a longer flight time.
When the CI is set to its maximum value, the opposite occurs. The FMS treats time as infinitely expensive. The aircraft climbs at higher speeds with a shallower gradient, cruises closer to VMO/MMO (maximum operating speed), and descends earlier and faster. This minimizes block time but burns considerably more fuel.
Most airline operations fall between these two extremes. Dispatchers and flight operations departments select a CI that reflects the airline’s current cost structure, route economics, and schedule constraints. The CI can also be adjusted in flight if, for example, a delay makes an on-time arrival more valuable than fuel savings.
Boeing vs. Airbus Cost Index: Key Differences
Although the underlying concept is identical, Boeing and Airbus use different units and scales for the cost index, which means the same CI number produces very different results depending on the aircraft manufacturer.
Boeing defines the cost index as the cost of time in dollars per hour divided by the cost of fuel in dollars per 100 pounds. The resulting unit is expressed in 100 lb/hr. Boeing FMC CI ranges vary by airframe and FMC generation: the 737 Classics (300/400/500) use a range of 0 to 200, the 737NG series supports 0 to 500 or 0 to 9999 depending on the installed FMC software, and widebodies like the 747-400, 767, and 777 typically support 0 to 9999. The 757/767 specifically has 0 to 999 with the Honeywell 200K and 700K FMC or 0 to 9999 with later FMC variants.
Airbus defines the cost index as the cost of time in dollars per minute divided by the cost of fuel in dollars per kilogram. The resulting unit is expressed in kg/min. The standard Airbus CI range is 0 to 999 across the A320 family, A330, and A340 platforms.
To convert between the two systems, the Boeing CI is approximately equal to the Airbus CI multiplied by 1.32. This conversion factor accounts for the difference between pounds and kilograms and between hourly and per-minute time cost accounting.
What Costs Make Up the Time Component?
The time-related cost side of the cost index captures every expense that increases as the aircraft spends more time airborne or away from the gate. These include crew wages and overtime pay (particularly for pilots paid by the flight hour rather than by salary), hourly maintenance program charges for engines and airframe, lease payments structured on a per-flight-hour basis, and per-hour insurance premiums.
Beyond direct operating costs, airlines sometimes factor in indirect time costs such as passenger re-accommodation expenses when delays cause missed connections, loss of goodwill and future booking revenue from chronically late arrivals, airport curfew penalties for arriving after noise restriction hours, and slot utilization fees at congested airports where a late arrival may forfeit a departure slot.
The structure of an airline’s contracts determines which of these costs are truly variable. A salaried flight crew adds no incremental time cost per hour, so an airline with salaried pilots will have a lower time-cost numerator than one with hourly-pay pilots, all else being equal. Similarly, an airline that leases engines on a fixed monthly rate rather than a per-cycle or per-hour rate will exclude that cost from the time component. These contract differences are a major reason why two airlines operating the same aircraft type on the same route may use very different CI values.
How Cost Index Affects Each Phase of Flight
The CI directly shapes the speed, altitude, and timing decisions the FMS makes during climb, cruise, and descent.
Climb: At CI = 0, the FMS commands the best rate-of-climb airspeed, which is typically the slowest climb speed but gets the aircraft to its fuel-efficient cruise altitude in the minimum amount of time (vertical distance per minute). As the CI increases toward maximum, the FMS selects a faster indicated airspeed in the climb, producing a shallower climb gradient, a longer ground distance to the top of climb, and a higher fuel burn during the climb phase.
Cruise: At CI = 0, the FMS selects the maximum range cruise (MRC) speed, which produces the lowest fuel burn per nautical mile. The optimum cruise altitude tends to be higher at low CI values because thinner air at altitude reduces drag. As CI increases, cruise speed rises toward the long range cruise (LRC) speed and eventually toward VMO/MMO. The FMS may also suggest a somewhat lower initial cruise altitude at high CI values because reaching the highest altitude takes time and a high CI penalizes time. Wind optimization also interacts with CI: the FMS may add approximately 0.01 Mach in a headwind or subtract 0.01 Mach in a tailwind once the wind component exceeds a programmed threshold.
Descent: At CI = 0, the FMS initiates the descent later and uses a slower descent speed, allowing the aircraft to stay at its fuel-efficient cruise altitude as long as possible. At high CI values, the descent begins earlier and at a faster speed, prioritizing an early arrival at the destination.
Typical Cost Index Values by Airline and Aircraft
CI values vary widely across the industry depending on an airline’s business model, cost structure, fleet type, and route characteristics. Low-cost carriers that prioritize fuel savings tend to use lower CI values, while full-service carriers with expensive hub connectivity and crew overtime provisions often use higher values. Below is a representative sample of reported CI values from various operators.
| Airline | Aircraft | Reported CI |
|---|---|---|
| Ryanair | B737 | 6 |
| Royal Air Maroc | B738 | 24 |
| Southwest Airlines | B737 MAX | 30 |
| Southwest Airlines | B737NG | 36 to 40 |
| Emirates | A320 | 23 |
| Emirates | A330 | 26 |
| Emirates | B777-200 | 37 |
| Emirates | B777-300ER | 44 |
| Etihad Airways | A320 (no sharklets) | 16 |
| Etihad Airways | A320 (sharklets) | 15 |
| Etihad Airways | A332 | 23 |
| Etihad Airways | B777-300ER | 43 to 45 |
| Virgin Atlantic | A333 (under 4 hrs) | 32 |
| Virgin Atlantic | B737NG (over 4 hrs) | 30 |
Notice that most operational CI values fall between 5 and 50, even though the FMC scale may extend to 999 or 9999. The majority of the CI range above roughly 100 is rarely used in scheduled airline operations and exists primarily for non-revenue ferry flights, emergency diversions, or ad hoc schedule recovery situations.
FMC Cost Index Ranges by Aircraft Type
| Aircraft | FMC CI Range | Unit System |
|---|---|---|
| Boeing 737-300/400/500 (Classics) | 0 to 200 | 100 lb/hr |
| Boeing 737-600/700/800 (NG) | 0 to 500 or 0 to 9999 | 100 lb/hr |
| Boeing 747-400 | 0 to 9999 | 100 lb/hr |
| Boeing 757/767 (Honeywell 200K/700K FMC) | 0 to 999 | 100 lb/hr |
| Boeing 757/767 (later FMC variants) | 0 to 9999 | 100 lb/hr |
| Boeing 777 | 0 to 9999 | 100 lb/hr |
| Airbus A320 family | 0 to 999 | kg/min |
| Airbus A330 | 0 to 999 | kg/min |
| Airbus A340 | 0 to 999 | kg/min |
Fuel Savings and Operational Impact
Small changes in the cost index can produce measurable fuel savings across a fleet. Research on the Boeing 737-700 found that the difference between operating at CI 45 versus CI 12 amounts to roughly $1,790 to $1,970 per flight, depending on fuel prices. Across a fleet of 100 narrowbody aircraft each flying four sectors per day, even a modest CI reduction of 5 to 10 points can yield annual fuel savings in the range of several million dollars.
Studies have shown that higher savings come from optimizing cruise speed than from optimizing altitude alone. Speed optimization has been estimated to produce fuel savings of approximately 2.4%, compared to about 1.5% from altitude optimization. When both are combined through proper CI selection, the total fuel reduction can exceed 3% on a per-flight basis.
The operational tradeoff is straightforward: flying at a lower CI saves fuel but adds flight time, while flying at a higher CI reduces flight time but burns more fuel. The cost index exists to find the speed at which the marginal cost of saving one more minute of flight time exactly equals the marginal cost of the extra fuel required. At that equilibrium, total trip cost is minimized.
When and Why Airlines Adjust Cost Index in Flight
The CI is not always fixed for the duration of a flight. Dispatchers or pilots may update it based on real-time operational conditions. If an aircraft departs late and an on-time arrival is critical for passenger connections or a curfew at the destination, the CI may be increased mid-flight to recover time. Conversely, if an aircraft is well ahead of schedule and fuel prices are high, the CI may be decreased to save fuel during the remaining cruise segment.
Some airlines use a strategic CI approach where different CI values are assigned to different route types. Short-haul flights with tight turnarounds may receive a higher CI to protect schedule integrity, while long-haul flights with generous buffer time may receive a lower CI to maximize fuel savings over a longer distance where even small speed reductions compound into significant fuel differences.
Airlines with advanced flight operations analytics may also use dynamic CI models that recalculate the optimal CI before each flight based on current jet fuel spot prices, crew scheduling constraints, expected en-route winds, and the estimated cost of delay at the destination. This approach moves beyond a single fleet-wide CI to a flight-specific optimization.
Cost Index and Carbon Emissions
Because the cost index directly controls cruise speed and fuel burn, it has a direct relationship with carbon dioxide emissions. Every kilogram of jet fuel burned produces approximately 3.16 kg of CO2. Lowering the CI reduces fuel consumption and therefore reduces the carbon footprint of each flight proportionally.
As carbon pricing mechanisms such as the EU Emissions Trading System (EU ETS) and CORSIA (Carbon Offsetting and Reduction Scheme for International Aviation) become more widespread, the cost of carbon is increasingly factored into the fuel cost side of the CI equation. When carbon costs are added to the per-unit price of fuel, the effective fuel cost rises, which mathematically lowers the optimal CI and shifts the speed profile toward greater fuel efficiency. This creates a feedback loop where environmental regulation directly influences the CI that minimizes total operating cost.