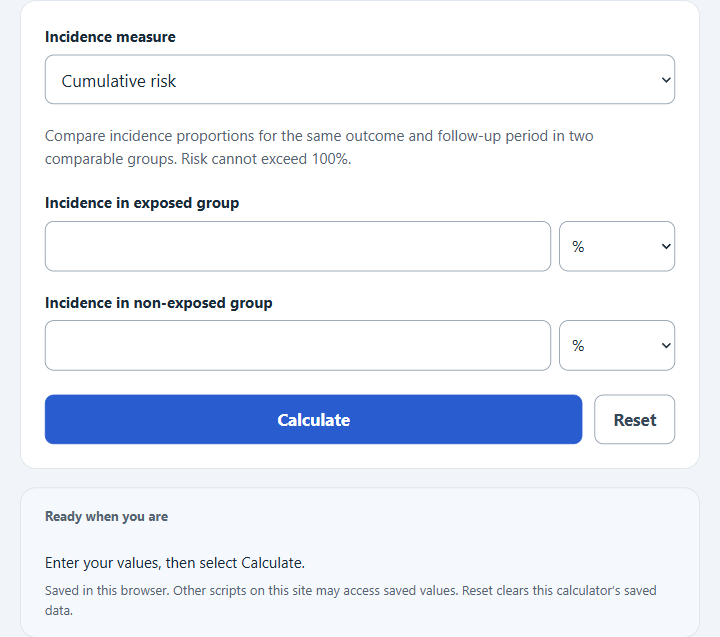
Calculate attributable risk percent from exposed and non-exposed group incidence rates, with inputs in percent or per 1,000 to 100,000.
Related Calculators
- Cumulative Incidence Calculator
- Adjusted Odds Ratio Calculator
- Cohort Study Sample Size Calculator
- Cochran’s Sample Size Calculator
- All Statistics Calculators
Attributable Risk Percent Formula
Attributable risk percent expresses excess incidence as a percentage of exposed-group incidence. Causal attribution requires a causal relationship and comparable groups. Choose cumulative risk or a rate per person-time; the calculator normalizes the input scales before applying the formula.
- ARP = attributable risk percent
- I_e = incidence in the exposed group
- I_0 = incidence in the non-exposed group
For cumulative risks expressed per a number of people, the following conversions give percentages. For incidence rates per person-time, use the separate rate mode and the same time unit in both groups; a person-time rate is not a percentage.
The exposed incidence must be greater than 0 because it is the denominator in the formula. If the result is negative, the incidence is lower in the exposed group than in the non-exposed group, which may reflect a protective association but does not establish causation. Negative ARP is not the prevented fraction.
Incidence Unit Conversions
Use the same type of incidence measure and comparable follow-up for both groups. Different denominator scales are converted consistently. Cumulative risks must be 0–100%; person-time rates have no 100% upper limit. The table below applies to cumulative risk.
| Input unit | Conversion to percent | Example |
|---|---|---|
| Percent | Use as entered | 12% = 12% |
| Per 1,000 | Multiply by 0.1 | 40 per 1,000 = 4% |
| Per 10,000 | Multiply by 0.01 | 250 per 10,000 = 2.5% |
| Per 100,000 | Multiply by 0.001 | 900 per 100,000 = 0.9% |
How to Interpret Attributable Risk Percent
| ARP result | Interpretation |
|---|---|
| Positive | The exposed group has higher incidence. With a supported causal relationship and comparable groups, the result estimates the percent of exposed-group incidence attributable to the exposure. |
| 0% | The exposed and non-exposed groups have the same incidence. |
| Negative | The exposed group has lower incidence. This can suggest a protective association. |
Example
Example 1: Incidence entered as percentages
Suppose the incidence in the exposed group is 20%, and the incidence in the non-exposed group is 8%.
This means 60% of the incidence among the exposed group is attributable to the exposure, assuming the relationship is causal and the study design supports that interpretation.
Example 2: Cumulative incidence entered per 1,000
Suppose the incidence in the exposed group is 50 per 1,000, and the incidence in the non-exposed group is 20 per 1,000.
First convert both values to percent:
Then calculate attributable risk percent:
FAQ
What does attributable risk percent mean?
Attributable risk percent is the percentage of disease or outcome incidence in the exposed group that can be attributed to the exposure. For example, an ARP of 60% means 60% of the exposed group’s incidence is associated with the exposure, assuming the exposure is causal.
Is attributable risk percent the same as attributable risk?
No. Attributable risk is an absolute difference in incidence, calculated as exposed incidence minus non-exposed incidence. Attributable risk percent expresses that difference as a percentage of the incidence in the exposed group.
Can attributable risk percent be negative?
Yes. A negative result occurs when the incidence in the exposed group is lower than the incidence in the non-exposed group. This can happen when the exposure is associated with lower risk, but you should interpret it in the context of the study design, sample size, and possible confounding factors.