Calculate horizontal analysis to find the missing comparison year value, base year value, or percentage from two dollar amounts in financial analysis.
- All Business Calculators
- Vertical Analysis Calculator
- Conversion Cost Calculator
- Cost Function Calculator
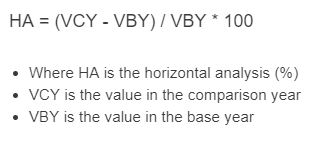
Horizontal Analysis Formula
Horizontal analysis measures the percentage change in a financial statement item from a base period to a comparison period. It is used to evaluate how revenue, expenses, profit, assets, liabilities, or cash flow have changed over time.
- HA = horizontal analysis result as a percentage
- VCY = value in the comparison year
- VBY = value in the base year
If you need to solve for a missing input instead of the percentage change, these rearranged forms are useful:
How to Calculate Horizontal Analysis
- Choose a base year value.
- Choose the comparison year value.
- Subtract the base year from the comparison year.
- Divide the difference by the base year.
- Multiply by 100 to convert the result to a percent.
This tells you how much the comparison period changed relative to the base period. A positive result indicates growth, while a negative result indicates decline.
| Result | Meaning | Interpretation |
|---|---|---|
| Positive % | Comparison year is greater than base year | Increase or growth |
| Negative % | Comparison year is less than base year | Decrease or decline |
| 0% | No change | Flat performance |
Example Calculations
If revenue was $250,000 in the base year and $300,000 in the comparison year, the percentage change is:
This means revenue increased by 20% relative to the base year.
If operating expenses were $80,000 in the base year and $68,000 in the comparison year, then:
This means operating expenses decreased by 15% from the base year.
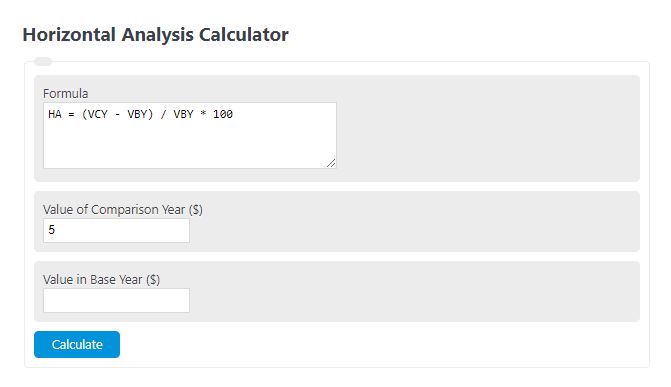
How to Use the Horizontal Analysis Calculator
- Enter the comparison year value.
- Enter the base year value.
- The calculator returns the horizontal analysis percentage.
- If your version allows solving for a missing field, enter any two known values to compute the third.
For the most reliable result, use values that are measured on the same basis, such as annual revenue to annual revenue or quarterly expense to quarterly expense.
Where Horizontal Analysis Is Useful
- Income statement analysis: revenue, cost of goods sold, operating expenses, and net income
- Balance sheet analysis: cash, inventory, debt, and retained earnings
- Cash flow analysis: operating, investing, and financing cash flows
- Budget review: actual results versus a prior year benchmark
- Trend monitoring: spotting acceleration, slowdown, or reversal in performance
Analysts commonly apply horizontal analysis to each major line item to quickly identify which accounts are growing faster, shrinking, or remaining stable over time.
Interpretation Tips
- A large positive percentage can signal strong growth, but it can also reflect a very small base year.
- A negative percentage is not always bad. Lower expenses, lower returns, or lower bad debt may be favorable.
- A result near 0% suggests stability, which may or may not be desirable depending on the account.
- Always interpret the percentage together with the dollar change. A high percent change on a tiny amount may be less important than a small percent change on a large amount.
Common Mistakes
- Using a base year of zero: division by zero makes the percentage undefined.
- Comparing inconsistent periods: do not compare one month to one year or audited figures to preliminary figures without adjustment.
- Ignoring negative base values: when the base year is negative, the percentage can be difficult to interpret and may require additional context.
- Overlooking one-time events: asset sales, write-downs, restructuring charges, or unusual gains can distort trend analysis.
- Looking at one line item in isolation: revenue growth means more when considered alongside margin, expense, and cash flow changes.
Horizontal Analysis vs. Vertical Analysis
| Method | Focus | Primary Question |
|---|---|---|
| Horizontal Analysis | Change across time | How much did this item increase or decrease from the base period? |
| Vertical Analysis | Proportion within one statement | What share of revenue, total assets, or another total does this item represent? |
Horizontal analysis is best for trend detection. Vertical analysis is best for structure and composition. Using both together gives a clearer picture of performance.
Frequently Asked Questions
What does a negative horizontal analysis result mean?
A negative result means the comparison year value is lower than the base year value. For revenue or profit this often indicates contraction, while for expenses it may represent improvement.
Can horizontal analysis be used on balance sheet accounts?
Yes. It is commonly used for assets, liabilities, and equity balances to evaluate changes in liquidity, leverage, and capital structure over time.
What happens if the base year value is zero?
The percentage change cannot be calculated because the formula divides by the base year. In that situation, review the raw dollar change instead of a percentage.
Is a bigger percentage always better?
No. A larger percentage is only better when the underlying line item is favorable. Higher revenue may be positive, but higher expenses, losses, or liabilities may not be.