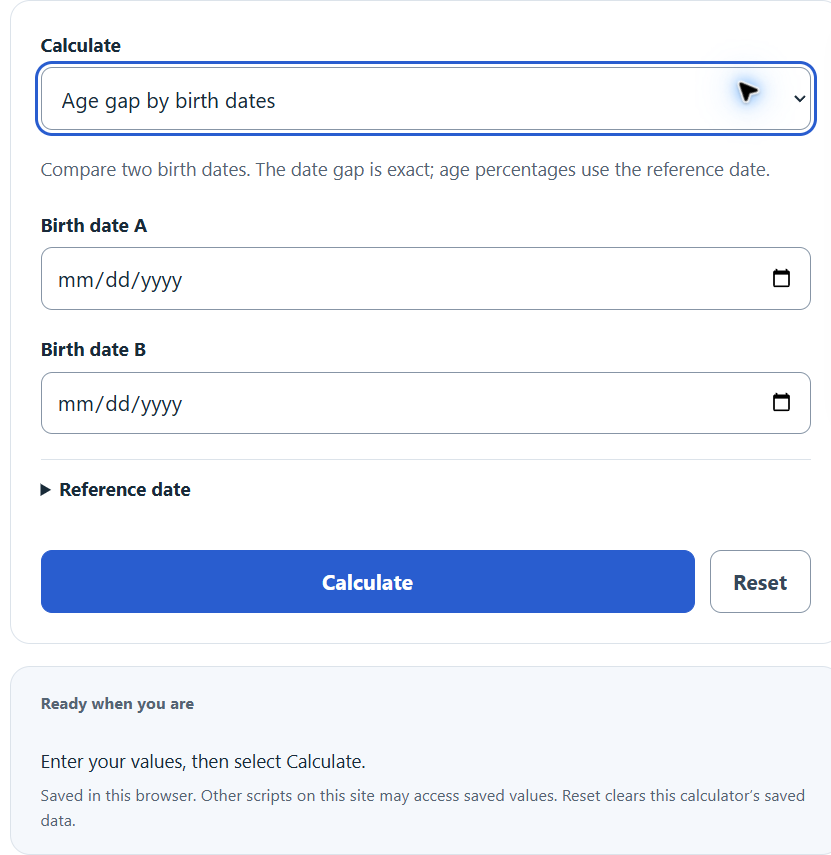
Calculate the gap between two birth dates or ages, or explore the half-age-plus-seven formula. The formula is a cultural heuristic, not a relationship recommendation or legal threshold.
Related Calculators
- Half Birthday Calculator
- Leap Calculator
- 18 Months From Calculator
- 9 3/4 Months Old Calculator
- All Everyday Life and Education Calculators
Acceptable Age Gap Formula
The cultural half-age-plus-seven heuristic uses this lower bound:
Where AG is the heuristic lower bound in years and O is the older person’s age in years. The inverse upper bound is: Maximum Age = (Your Age – 7) x 2. For example, age 40 gives mathematical bounds of 27 to 66, while age 24 gives 19 to 34. These bounds do not establish compatibility, consent, legality or safety. Below age 14, the lower bound exceeds the upper bound, so no nonempty range exists.
Origin of the Half-Your-Age-Plus-Seven Rule
The rule traces back to French author Max O’Rell (real name Leon Paul Blouet), who published it in his 1901 book “Her Royal Highness Woman and His Majesty Cupid.” In that context, the formula described the ideal age of a bride relative to the groom, not a general dating guideline. French entertainer Maurice Chevalier referenced the rule in a 1931 interview with the Detroit News, and it appeared again in the 1951 American play “The Moon Is Blue” and its 1953 film adaptation. During the 1950s, Nation of Islam leader Elijah Muhammad taught the formula as guidance for selecting a wife’s ideal age. Over the course of the 20th century, the rule expanded from a marriage-specific norm into a general dating guideline applied to partners of any gender.
What is an Acceptable Age Gap?
An acceptable age gap is the range of years between two partners that falls within prevailing social norms for a given culture and time period. In practice, this varies widely. Pew Research Center’s analysis of U.S. Census Bureau American Community Survey data shows that the average age difference between American spouses was 2.2 years as of 2022, down from 2.4 years in 2000 and 4.9 years in 1880. About 51% of opposite-sex marriages in the U.S. have spouses within two years of each other’s age. Pew’s 2019 global household study found that men living with a spouse or partner were, on average, about four years older than that partner.
Age Gap Data by Region and Religion
Regional averages differ substantially. Pew’s 2019 household study reported average partner age gaps of 8.6 years in sub-Saharan Africa and less than three years in Europe and North America. These population averages describe observed households; they do not define an acceptable gap for an individual couple.
Religious affiliation also correlates with spousal age gaps. Pew Research Center data shows Muslim couples have the widest average gap at 6.6 years, followed by Hindu couples at 5.6 years, Christian couples at 3.8 years, Buddhist couples at 2.9 years, religiously unaffiliated couples at 2.3 years, and Jewish couples at 2.1 years.
Relationship Outcomes and Divorce Rates by Age Gap
A 2014 Emory University study of 3,000 individuals found that couples with a 5-year age gap were 18% more likely to divorce than same-age couples, and the likelihood increased with larger gaps. Research from the University of Colorado (2017) found that partners who married someone significantly younger were initially happier than same-age couples, but experienced a sharper decline in satisfaction after six to ten years. These observational findings do not predict whether an individual relationship will succeed.
A Danish longitudinal study found that men partnered with younger women had lower observed mortality risk. This association does not establish that a younger spouse causes longer life. For women, the lowest mortality risk was associated with having a partner of the same age. Data also shows that remarried men tend to have larger age gaps: 56% of remarried husbands have a wife three or more years younger, compared to 35% of first-marriage husbands.
Same-Sex Couples and Modern Trends
Same-sex couples tend to have larger age gaps on average than opposite-sex couples. Male same-sex couples show significantly different age gap distributions than female same-sex couples, which means grouping all same-sex relationships into a single category obscures meaningful differences.
Several trends are reshaping age gap norms. A UK study found the proportion of women marrying younger men rose from 15% to 26% between 1963 and 1998. Ipsos polling data shows that 39% of American adults had dated someone with an age difference of 10 or more years in its May 2022 survey. Younger adults (ages 18 to 34) are the most likely to feel social pressure about age gap relationships, with 24% reporting concern about others’ judgment, compared to 6% of those 55 and older.
Limitations of the Half-Your-Age-Plus-Seven Rule
The rule has notable mathematical edge cases. It produces a minimum age of 14 for a 14-year-old (effectively no gap allowed), but for anyone under 14, the formula yields a minimum partner age older than themselves. At higher ages, the rule becomes increasingly permissive: a 70-year-old gets a minimum of 42 and a maximum of 126, which clearly exceeds any realistic boundary. A 2001 study published in the journal “Personal Relationships” found the rule roughly matched men’s stated minimum age preferences for partners, but was less accurate for women’s preferences or for adults in their mid-30s, who tended to seek younger partners than the formula would predict. The rule also has no scientific or psychological basis. It is a cultural heuristic, not a research-derived threshold, and it does not account for individual maturity, life stage, or the specific dynamics of any given relationship.
Calculator Change Log:
- 6/5/25 – Added additional features for calculating age gap by date and years, as well as acceptable partner age from current age.