Calculate your acute to chronic workload ratio (ACWR) from weekly training loads, see your injury risk zone, and plan a safe next-week load range.
Acute:Chronic Workload Ratio Formula
The acute:chronic workload ratio compares the training load you completed in the last 7 days to the average weekly load you completed over the last 28 days:
ACWR = A / C
In the standard coupled method, the chronic load is the average of the last four weekly loads, including the current week. The uncoupled method averages only the three earlier weeks so the acute week does not appear in both the numerator and the denominator:
C(coupled) = (W1 + W2 + W3 + W4) / 4
 C(uncoupled) = (W1 + W2 + W3) / 3
To plan a week instead of grading one, the same formula is rearranged to solve for the acute load that keeps the ratio inside the sweet spot:
0.8 * C <= A <= 1.3 * C
- ACWR is the acute:chronic workload ratio (unitless)
- A is the acute load, the total training load of the most recent 7 days
- C is the chronic load, the average weekly load over the last 28 days
- W1 through W4 are the four weekly load totals, with W1 the oldest and W4 the most recent (W4 = A)
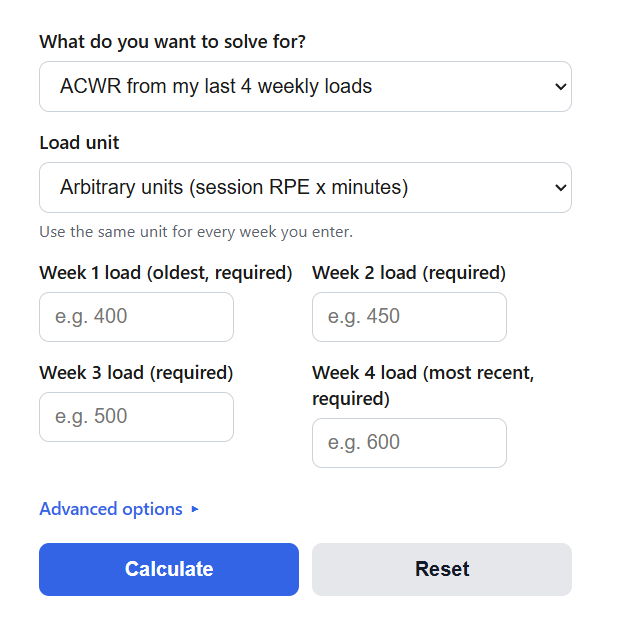
The calculator applies these formulas in three modes. The weekly mode takes your last four weekly loads, computes the chronic average with either the coupled or uncoupled method, and divides week 4 by it. The direct mode divides an acute and chronic load you already know. The planner mode inverts the formula: it multiplies your chronic load by 0.8 and 1.3 to return the weekly load range that lands in the sweet spot, flags the load at which the ratio would pass 1.5, and, if you enter a planned week, grades that plan and estimates your new chronic load afterward. Load can be any consistent unit: session RPE times minutes (arbitrary units), kilometers, miles, or total training minutes.
ACWR Zones and Safe Weekly Load Ranges
Team sport research, most notably by Tim Gabbett, links injury risk to the ratio in a U-shaped pattern. Risk is lowest between 0.8 and 1.3 and climbs sharply above 1.5, while very low ratios leave you underprepared for a return to normal training.
| ACWR | Zone | What it means | Typical action |
|---|---|---|---|
| Below 0.80 | Undertraining | Load is well below what your body is prepared for; fitness fades and risk rises when normal loading resumes | Rebuild gradually toward your chronic level |
| 0.80 to 1.30 | Sweet spot | Lowest reported injury risk; enough stimulus to build fitness without outrunning your base | Progress steadily week to week |
| 1.30 to 1.50 | Caution | Acute spike above what your chronic training has prepared you for; soft tissue risk is elevated | Hold or trim load and watch recovery |
| Above 1.50 | High risk | Studies report injury risk roughly 2 to 4 times higher in the weeks after spikes of this size | Cut back now and raise the chronic base first |
Because the zone boundaries are fixed ratios, you can convert them into a personal weekly load budget by multiplying your chronic load by 0.8, 1.3, and 1.5. The table below does this for a range of chronic loads. It works in any unit, so a chronic load of 400 could be 400 arbitrary units of session RPE work or a scaled version of your weekly mileage.
| Chronic load (weekly avg) | Sweet spot next week (0.8 to 1.3) | High risk above (1.5) |
|---|---|---|
| 100 | 80 to 130 | 150 |
| 200 | 160 to 260 | 300 |
| 300 | 240 to 390 | 450 |
| 400 | 320 to 520 | 600 |
| 500 | 400 to 650 | 750 |
| 750 | 600 to 975 | 1125 |
| 1000 | 800 to 1300 | 1500 |
Example Problems
Example 1: ACWR from four weekly loads. A runner logs session RPE loads of 400, 450, 500, and 600 arbitrary units over the last four weeks, with 600 being the most recent week. The coupled chronic load is (400 + 450 + 500 + 600) / 4 = 487.5, so ACWR = 600 / 487.5 = 1.23. That sits inside the sweet spot, though near its top edge, since the load ran 23% above the chronic average. With the uncoupled method the chronic load is (400 + 450 + 500) / 3 = 450, and ACWR = 600 / 450 = 1.33, which tips into the caution zone. Same training, different method, different verdict, which is why you should pick one method and stay with it.
Example 2: planning next week. A cyclist averages 40 km per week over the last 4 weeks. Multiplying by 0.8 and 1.3 gives a sweet spot range of 32 to 52 km, and the 1.5 threshold sits at 60 km. A planned 65 km week would give ACWR = 65 / 40 = 1.63, well into the high risk zone. Capping the week at 52 km keeps the ratio at 1.3, and the chronic load afterward would rise to about (3 x 40 + 52) / 4 = 43 km, which raises the following week’s safe range as fitness builds.
Frequently Asked Questions
What is a good acute:chronic workload ratio?
A ratio between 0.8 and 1.3 is the range most often associated with the lowest injury risk in the research, so it is the usual target. A ratio near 1.0 means you trained this week almost exactly at your 4-week average. Ratios above 1.5 have been linked with a sharp rise in soft tissue injury risk in the following weeks, and ratios that sit chronically below 0.8 suggest you are training below the level your body has adapted to, which erodes the fitness that protects you. Context still matters: a planned taper before a race will show a low ratio on purpose, and a single high reading in an athlete with a large training base is less alarming than the same number in someone returning from time off.
Should I use the coupled or uncoupled method?
The coupled method, which includes the current week in the 4-week average, is the original and most widely used approach, so use it if you want numbers comparable to most published thresholds and team dashboards. Its drawback is mathematical: because the acute week is part of the chronic average, the ratio is pulled toward 1.0 and can never exceed 4.0. The uncoupled method averages only the three earlier weeks, keeps the two sides independent, and reads slightly higher for the same data, as Example 1 shows. Either is defensible for self-monitoring. What matters is consistency, because switching methods mid-season makes your trend line jump for reasons that have nothing to do with training.
How is this different from the EWMA version of ACWR?
The rolling average used here treats every day in the window equally: a hard session 27 days ago counts as much toward chronic load as one from last night. The exponentially weighted moving average (EWMA) variant instead applies a decay factor, lambda = 2 / (N + 1), about 0.25 for the 7-day acute window and 0.069 for the 28-day chronic window, so recent days weigh more and the ratio reacts faster to sudden spikes. Research comparing the two suggests EWMA is more sensitive for flagging injury risk, but it must be computed from a continuous daily log, which is why spreadsheet and app implementations use it while quick weekly check-ins use the rolling average. If you track daily loads in a training platform, treat this calculator’s rolling average as the simple cross-check and the EWMA trend as the finer instrument.