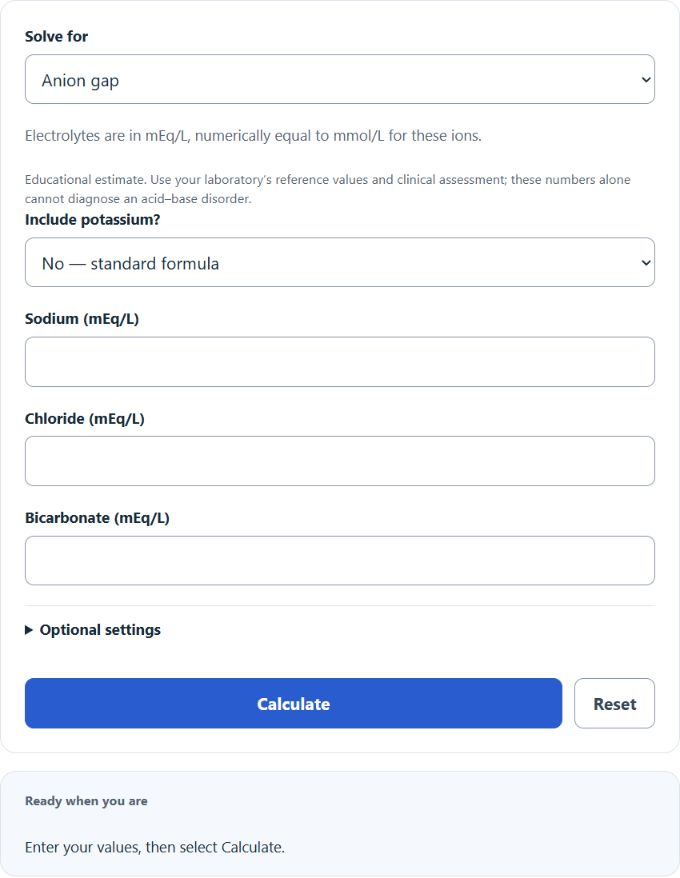
Calculate the serum anion gap from sodium, chloride, and bicarbonate, add potassium or albumin correction, and get the delta ratio to flag mixed acidosis.
Anion Gap Formula
The anion gap is the difference between the sodium you measure and the chloride and bicarbonate you measure. The standard serum formula is:
AG = Na - (Cl + HCO3)
Some labs add potassium for a more complete cation total. When you include it, the formula becomes:
AG = Na + K - (Cl + HCO3)
A low albumin level lowers the measured gap and can hide a real acidosis, so the gap is often corrected for albumin using the Figge equation:
Corrected AG = AG + 2.5 * (Normal albumin - Measured albumin)
In a high anion gap acidosis, the delta ratio compares how far the gap has risen against how far the bicarbonate has fallen, which helps flag a second acid-base problem:
Delta ratio = (corrected AG - baseline AG) / (baseline bicarbonate - HCO3)
Winter’s formula estimates the pCO2 you would expect if the lungs are compensating normally for a metabolic acidosis:
Expected pCO2 = 1.5 * HCO3 + 8 (plus or minus 2)
Variables:
- AG is the anion gap in mEq/L (equal to mmol/L)
- Na is serum sodium, the main measured cation
- K is serum potassium, included only when you choose the potassium option
- Cl is serum chloride and HCO3 is serum bicarbonate, the two measured anions
- Measured albumin is the patient’s albumin in g/dL, and normal albumin is the reference value, about 4.0 g/dL
- 2.5 is the rise in gap, in mEq/L, for every 1 g/dL that albumin sits below normal
- 12 is the reference normal anion gap and 24 is the reference normal bicarbonate used for the delta ratio
- pCO2 is the arterial carbon dioxide pressure in mmHg
Choose Anion gap, Albumin-corrected anion gap, or Delta ratio and respiratory compensation. The potassium choice adds potassium to the formula. Optional settings let you enter laboratory reference limits and baseline values. Blank albumin reference uses 4 g/dL; baseline bicarbonate uses 24 mEq/L; baseline gap uses 12 without potassium or 16 with potassium. The delta ratio is shown only when the corrected gap is above baseline and bicarbonate is below baseline. Its approximate bands are guides in an established metabolic acidosis, not diagnostic cutoffs. Winter’s formula also requires metabolic acidosis; low bicarbonate alone is insufficient. Inputs are saved for 24 hours only if you choose that option.
Anion Gap Results and Common Causes
This table sets the usual reference bands and the conditions behind each result. Ranges shift with the lab method and with whether potassium is in the formula, so read your own report’s range first.
| Result (no potassium) | What it suggests | Common causes |
|---|---|---|
| High, above 12 mEq/L | Elevated gap; assess for metabolic acidosis in clinical context | Lactic acidosis, ketoacidosis, kidney failure, toxins (methanol, ethylene glycol, salicylate) |
| Normal, about 8 to 12 mEq/L | Normal gap, or a hyperchloremic acidosis if pH is low | Diarrhea, renal tubular acidosis, carbonic anhydrase inhibitors |
| Low, below 8 mEq/L | Low anion gap, usually not an acid problem | Low albumin, lithium, bromide, paraproteins from myeloma, high calcium |
Reference intervals depend on the laboratory method and on whether potassium is included. The calculator’s default intervals, 8 to 12 without potassium and 12 to 16 with potassium, are illustrative assumptions that can be replaced with your laboratory’s limits.
Expected pCO2 by Bicarbonate Level
Most anion gap tools stop at the gap. This reference goes one step further and shows the pCO2 you would expect from Winter’s formula in a metabolic acidosis. If the measured pCO2 sits above the range there is an added respiratory acidosis, and if it sits below the range there is an added respiratory alkalosis.
| Bicarbonate (mEq/L) | Expected pCO2 (mmHg) | Expected range (mmHg) |
|---|---|---|
| 6 | 17 | 15 to 19 |
| 10 | 23 | 21 to 25 |
| 14 | 29 | 27 to 31 |
| 18 | 35 | 33 to 37 |
| 22 | 41 | 39 to 43 |
Example Problems
Example 1: Basic anion gap.
Sodium is 138, chloride is 102, and bicarbonate is 22 mEq/L. Subtract the anions from the sodium:
AG = 138 – (102 + 22) = 14 mEq/L. That is above the calculator’s assumed 8 to 12 interval. Compare with the laboratory’s own range; a high gap alone does not establish metabolic acidosis.
Example 2: Full analysis with a low albumin.
Sodium is 135, chloride is 105, bicarbonate is 20 mEq/L, albumin is 2.0 g/dL, and the arterial pCO2 is 38 mmHg. The raw gap is AG = 135 – (105 + 20) = 10, which looks normal. Correcting for the low albumin gives 10 + 2.5 * (4.0 – 2.0) = 15, which is high, so the low albumin was masking a gap. The delta ratio using the corrected gap is (15 – 12) / (24 – 20) = 0.75, which suggests a mixed high gap and normal gap acidosis. Winter’s formula expects a pCO2 of 1.5 * 20 + 8 = 38, range 36 to 40, and the measured 38 falls inside it, so the breathing response is appropriate.
Frequently Asked Questions
What is a normal anion gap?
With the common formula that leaves out potassium, a normal gap is often quoted as 8 to 12 mEq/L, though many current analyzers report a lower band near 3 to 11 mEq/L. If you include potassium, add about 4 mEq/L to the range. The exact numbers depend on the lab, so compare your result against the reference range printed on your own report rather than a fixed textbook figure.
Why correct the anion gap for albumin?
Albumin is the largest unmeasured anion, so it makes up most of the normal gap. When albumin is low, which is common in critically ill patients, the gap drops by about 2.5 mEq/L for every 1 g/dL fall in albumin. That can pull a truly high gap down into the normal range and hide an acidosis. Correcting for albumin restores the gap you would expect at a normal albumin and makes a hidden high gap visible.
What does the delta ratio tell you?
The delta ratio checks whether the rise in the gap matches the fall in bicarbonate. A value near 1 fits a pure high gap acidosis, below about 0.8 suggests a second normal gap acidosis is also present, and above 2 suggests a metabolic alkalosis is masking part of the bicarbonate drop. One caution: the often-quoted 1.6 average for lactic acidosis comes from population data, and newer work using each patient’s own baseline and albumin-corrected gaps finds a mean closer to 1.2, so treat the bands as a guide rather than a hard cutoff.