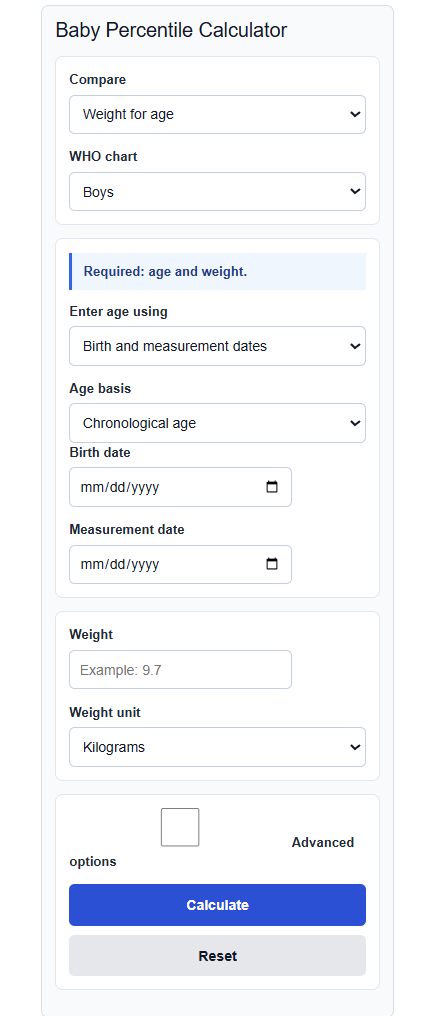
Calculate baby percentiles from your baby’s weight, length, and head circumference for their age and sex.
Customize This Calculator
Build your own version. Describe what you want changed, added, or compared.
Baby Percentile Formula
The calculator uses the WHO LMS method. It looks up three reference values for the baby's exact age (or length) and sex, finds a z-score, then converts that z-score into a percentile with the standard normal distribution.
Z = ((X / M)^L - 1) / (L * S)
Percentile = 50 * (1 + erf(Z / sqrt(2)))
When L is effectively zero, the z-score reduces to Z = ln(X / M) / S.
- X = the measured value (weight, length, head circumference)
- M = WHO median value for that age and sex
- L = power that corrects the skew in the distribution
- S = coefficient of variation
- Z = number of standard deviations from the median
- erf = error function, used to turn the z-score into a percentile
The compare selector chooses which chart is used: weight for age, length for age, head circumference for age, or weight for length. The WHO chart selector sets whether boys or girls reference values are loaded, since the L, M, and S values differ by sex. The age basis option lets you use chronological age or a corrected age for babies born premature, which shifts the lookup to an earlier reference age. A percentile near 50 means the measurement sits at the median, a low percentile means the value is below most same-age babies, and a high percentile means it is above most.
Reading the Percentile Result
A single percentile is a snapshot. Pediatricians watch the trend across visits more than any one number.
| Percentile range | General interpretation |
|---|---|
| Below 3rd | Smaller than most same-age babies; worth discussing with your pediatrician |
| 3rd to 15th | On the lower side of the typical range |
| 15th to 85th | Middle of the typical range |
| 85th to 97th | On the higher side of the typical range |
| Above 97th | Larger than most same-age babies; worth discussing with your pediatrician |
The table below shows approximate WHO median values to give a sense of scale. Your calculator result uses the exact age in days, so these rounded figures are only a reference.
| Age | Median weight, boys | Median weight, girls |
|---|---|---|
| Birth | 3.3 kg (7.3 lb) | 3.2 kg (7.0 lb) |
| 3 months | 6.4 kg (14.1 lb) | 5.8 kg (12.8 lb) |
| 6 months | 7.9 kg (17.4 lb) | 7.3 kg (16.1 lb) |
| 12 months | 9.6 kg (21.2 lb) | 8.9 kg (19.6 lb) |
| 24 months | 12.2 kg (26.9 lb) | 11.5 kg (25.4 lb) |
Example Calculations
Example 1: A 3-month-old boy weighs 6.4 kg. The WHO weight-for-age median at 3 months for boys is about 6.4 kg, so X equals M. That gives a z-score of 0, which maps to the 50th percentile. This baby weighs right at the median.
Example 2: A 6-month-old girl weighs 6.4 kg. The WHO median at 6 months for girls is about 7.3 kg, with reference values that put 6.4 kg near a z-score of about -1.3. Running that z-score through the normal distribution gives roughly the 10th percentile, meaning about 10 out of 100 same-age girls would weigh less.
FAQ
What does my baby's percentile actually mean?
A percentile compares your baby to a reference group of healthy babies of the same age and sex. A 40th percentile weight means about 40 out of 100 same-age babies weigh less than yours and about 60 weigh more. It is a position, not a grade, so a lower or higher number is not automatically good or bad.
Should I use chronological or corrected age for a premature baby?
For babies born before term, use corrected age until about 2 years old. Corrected age subtracts the number of weeks early from the chronological age, so the baby is compared to the reference values for the age they would be if born on the due date. Using chronological age for a premature baby makes the percentile look lower than it really is. Set the age basis to corrected and enter the weeks of prematurity.
Why did my baby's percentile change between visits?
Small shifts are normal because babies grow in spurts rather than at a steady rate. Pediatricians look for a consistent curve over time rather than one fixed number. A large or sudden drop or jump across several percentile bands is the kind of change worth raising with your pediatrician.