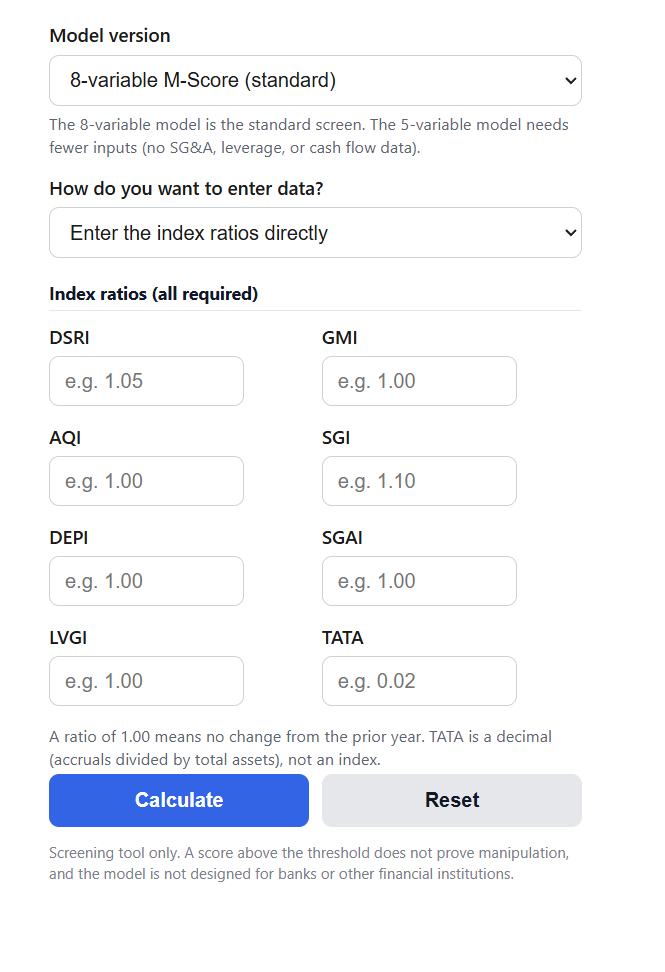
Calculate the Beneish M-Score from eight financial ratios to screen a company for possible earnings manipulation.
Beneish M-Score Formula
The standard 8-variable Beneish M-Score is a weighted sum of eight financial statement indices:
M = -4.84 + 0.920*DSRI + 0.528*GMI + 0.404*AQI + 0.892*SGI + 0.115*DEPI - 0.172*SGAI + 4.679*TATA - 0.327*LVGI
The original short version of the model uses five of the indices with different weights:
M = -6.065 + 0.823*DSRI + 0.906*GMI + 0.593*AQI + 0.717*SGI + 0.107*DEPI
Variables:
- DSRI is the Days Sales in Receivables Index: (Receivables / Sales) this year divided by the same ratio last year. Receivables growing faster than sales can signal aggressive revenue recognition.
- GMI is the Gross Margin Index: last year's gross margin divided by this year's. A value above 1 means margins are deteriorating.
- AQI is the Asset Quality Index: the share of total assets that are neither current assets, PP&E, nor securities, this year versus last year. A rising share of these "soft" assets can indicate cost capitalization.
- SGI is the Sales Growth Index: this year's sales divided by last year's sales.
- DEPI is the Depreciation Index: last year's depreciation rate divided by this year's. A value above 1 means depreciation has slowed, which lifts reported earnings.
- SGAI is the SG&A Index: SG&A as a share of sales this year versus last year.
- LVGI is the Leverage Index: (current liabilities + long-term debt) over total assets, this year versus last year.
- TATA is Total Accruals to Total Assets: (income from continuing operations - cash flow from operations) divided by total assets. This is a decimal, not an index.
The calculator works in two ways. If you already have the eight indices, enter them directly in ratio mode. If you only have the financial statements, switch to statement mode and enter the current-year and prior-year line items; the calculator derives each index for you before applying the weights. The model selector switches between the 8-variable and 5-variable formulas, and hides the inputs the short model does not need. Along with the score, the result shows each index's weighted contribution, a risk tier, and the implied probability of manipulation, which is the standard normal cumulative distribution evaluated at the M-Score.
M-Score Thresholds and Beneish Benchmark Values
The first table shows how to read the score. The most commonly used flag line is -1.78, while -2.22 is a more conservative cutoff; scores between the two deserve a closer look even though they are not formally flagged.
| M-Score | Reading | Suggested action |
|---|---|---|
| Above -1.78 | Likely manipulator under the model | Review receivables, accruals, and margin trends before trusting reported earnings |
| -2.22 to -1.78 | Borderline | Not flagged, but check which indices are pushing the score up |
| Below -2.22 | Unlikely manipulator | Low accounting-manipulation risk under the model; verify with other quality checks |
The second table lists the average value of each index for the non-manipulator and manipulator groups in Beneish's original 1999 study. Comparing your own inputs against these benchmarks shows which individual indices look suspicious even before the final score is computed. The calculator performs this comparison automatically in its results table.
| Index | Non-manipulator mean | Manipulator mean |
|---|---|---|
| DSRI | 1.031 | 1.465 |
| GMI | 1.014 | 1.193 |
| AQI | 1.039 | 1.254 |
| SGI | 1.134 | 1.607 |
| DEPI | 1.001 | 1.077 |
| SGAI | 1.054 | 1.041 |
| LVGI | 1.037 | 1.111 |
| TATA | 0.018 | 0.031 |
Example Problems
Example 1 (8-variable model). A company reports DSRI = 1.20, GMI = 1.10, AQI = 1.05, SGI = 1.30, DEPI = 1.00, SGAI = 0.95, LVGI = 1.02, and TATA = 0.04. Applying the weights:
M = -4.84 + 0.920*1.20 + 0.528*1.10 + 0.404*1.05 + 0.892*1.30 + 0.115*1.00 - 0.172*0.95 + 4.679*0.04 - 0.327*1.02 = -1.766
The score of -1.77 sits just above the -1.78 threshold, so the model flags the company as a likely manipulator. The receivables index, sales growth, and accruals are the main drivers, which points the review toward revenue recognition.
Example 2 (5-variable model). A slower-growing company shows DSRI = 1.00, GMI = 1.02, AQI = 1.00, SGI = 1.05, and DEPI = 1.00. Using the short model:
M = -6.065 + 0.823*1.00 + 0.906*1.02 + 0.593*1.00 + 0.717*1.05 + 0.107*1.00 = -2.865
A score of -2.87 is well below -2.22, so the company is unlikely to be manipulating earnings under the model.
Frequently Asked Questions
Which threshold should I use, -1.78 or -2.22?
Beneish's follow-up work with the 8-variable model supports -1.78 as the flag line, and it is the threshold most screeners use today. The -2.22 cutoff is a more conservative line that catches fewer false positives but misses more true manipulators. A practical approach is to treat anything above -1.78 as flagged and anything between -2.22 and -1.78 as a prompt to inspect the individual indices, especially DSRI and TATA.
Does a high M-Score prove a company is committing fraud?
No. The M-Score is a probabilistic screen, not an accusation. In Beneish's original sample the model correctly identified about 76% of manipulators while incorrectly flagging about 17.5% of non-manipulators, so both false positives and false negatives occur. Fast-growing but honest companies often trip the SGI and DSRI indices. Use a high score as a reason to read the filings closely, compare accruals with cash flow, and question unusual receivables growth, not as a verdict.
Can I use the M-Score on banks and insurance companies?
No. Financial institutions were excluded from the data used to build the model because their revenue does not flow through sales and receivables the way it does for operating companies. Ratios such as DSRI, GMI, and AQI are not meaningful for a bank's balance sheet, so the score will be unreliable. For financial firms, look instead at loan-loss provisioning, fair-value hierarchy disclosures, and regulatory capital trends.