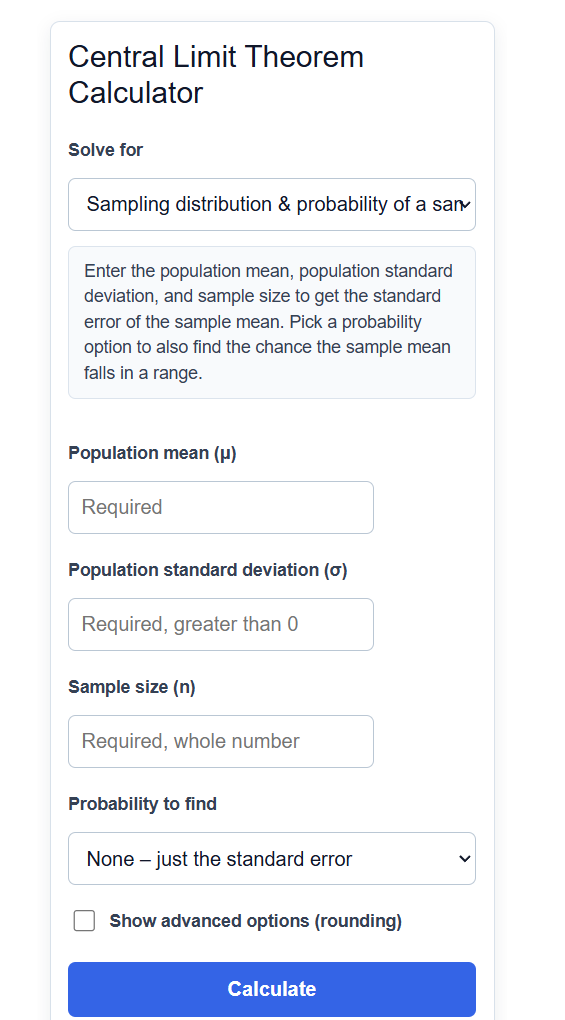
Calculate the sampling distribution of the mean, standard error, z-score probabilities, confidence intervals, and required sample size using the central limit theorem.
Central Limit Theorem Formula
The central limit theorem says that when you take random samples of size n from a population with mean μ and standard deviation σ, the distribution of the sample means is approximately normal once n is large enough (a common rule of thumb is n ≥ 30). The mean of that sampling distribution equals the population mean, and its spread is the standard error.
SE = sigma / sqrt(n)
To find the probability of a sample mean, convert the sample mean to a z-score using the standard error and read the area from the standard normal curve.
z = (x - mu) / (sigma / sqrt(n))
For a confidence interval for the mean when σ is known, the calculator uses the z critical value for your confidence level.
CI = xbar +/- z* * (sigma / sqrt(n))
To find the sample size needed for a target margin of error E, the calculator solves the margin of error equation for n.
n = (z* * sigma / E)^2
To find a sample-mean cutoff from a probability, the calculator inverts the z-score equation.
x = mu + z * (sigma / sqrt(n))
- μ is the population mean, the center of both the population and the sampling distribution of the mean.
- σ is the population standard deviation, which measures the spread of individual values.
- n is the sample size, the number of observations in each sample.
- SE is the standard error, the standard deviation of the sample mean. It shrinks as n grows.
- x̄ (xbar) is an observed sample mean, used to build a confidence interval.
- z and z* are values from the standard normal distribution. z is a test statistic for a specific sample mean, and z* is the critical value tied to a confidence level.
- E is the margin of error, the half-width of a confidence interval.
The "Solve for" selector controls which of these the calculator computes. The probability mode returns the standard error and the chance a sample mean falls below, above, between, or outside values you choose. The confidence-interval mode returns the interval around an observed sample mean. The sample-size mode returns the smallest n that hits your margin of error. The inverse mode returns the sample mean that sits at a chosen probability.
Common z Critical Values and Sample-Size Guidance
The confidence-interval and sample-size modes rely on z critical values. These are the standard values for the most common confidence levels.
| Confidence level | z* critical value |
|---|---|
| 80% | 1.282 |
| 90% | 1.645 |
| 95% | 1.960 |
| 98% | 2.326 |
| 99% | 2.576 |
Sample size controls how close the sampling distribution gets to normal and how small the standard error becomes.
| Sample size n | What to expect |
|---|---|
| n < 30 | Normal approximation is reliable only if the population is already roughly normal. For skewed data, use methods that do not assume normality. |
| n ≥ 30 | The sampling distribution of the mean is close to normal for most populations, so the z-based results here apply. |
| Larger n | The standard error keeps falling in proportion to 1/sqrt(n), so quadrupling n halves the standard error. |
Example Problems
Example 1: Probability of a sample mean. A population has a mean of 100 and a standard deviation of 15. You take a random sample of 36 values. First find the standard error: SE = 15 / sqrt(36) = 15 / 6 = 2.5. To find the chance the sample mean is below 104, compute z = (104 - 100) / 2.5 = 1.6. The standard normal area below z = 1.6 is about 0.9452, so the probability the sample mean is less than 104 is roughly 0.945.
Example 2: Required sample size. You want a 95% confidence interval for a mean with a margin of error no larger than 2, and the population standard deviation is 10. Using z* = 1.960, n = (1.960 * 10 / 2)^2 = (9.8)^2 = 96.04. Round up to a whole sample, so you need n = 97 observations.
Frequently Asked Questions
When does the central limit theorem apply? It applies to the distribution of the sample mean (or sum) for random, independent samples. For most populations the sampling distribution is close to normal once n is at least 30. If the population is already normal, it holds for any sample size. If the population is strongly skewed or has heavy tails, you may need a larger sample before the approximation is good.
What is the difference between the standard deviation and the standard error? The standard deviation σ measures the spread of individual values in the population. The standard error SE = σ / sqrt(n) measures the spread of the sample mean across many samples. The standard error is always smaller than the standard deviation when n is greater than 1, and it keeps shrinking as the sample size grows.
Why does this calculator use z values instead of t values? The central limit theorem describes the sampling distribution when the population standard deviation σ is known, which makes the standardized sample mean follow the standard normal (z) distribution. If you only have a sample standard deviation and a small sample, a t distribution is the better choice for confidence intervals and tests.