Calculate class size from upper and lower class boundaries, data range and number of classes, or total students and classes/teachers.
Related Calculators
- Sturges Rule Calculator
- Frequency Density Calculator
- Histogram Median Calculator
- Weighted Mean Calculator
- Z-Score Calculator
- All Everyday Life and Education Calculators
Class Size Formula
CS = UL - LL
Variables:
- CS is the class size (class width) of one class interval (in the same units as the data)
- UL is the upper class boundary/limit of that class interval
- LL is the lower class boundary/limit of that class interval
To calculate class size (class width), subtract the lower class boundary/limit of the class interval from the upper class boundary/limit. (Note: for discrete, inclusive class limits like 10–19, it is common to use class boundaries 9.5–19.5 so the width is 10.)
How to Calculate Class Size?
The following steps outline how to calculate the Class Size.
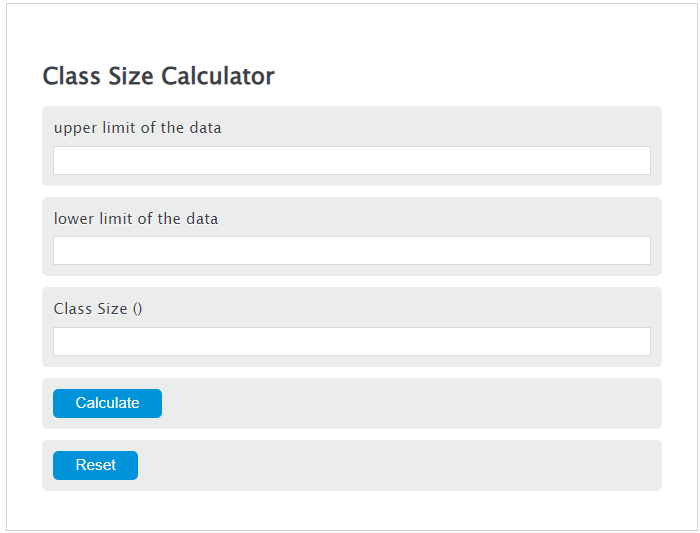
- First, determine the upper class boundary/limit of the class interval.
- Next, determine the lower class boundary/limit of the class interval.
- Next, gather the formula from above = CS = UL – LL.
- Finally, calculate the Class Size.
- After inserting the variables and calculating the result, check your answer with the calculator above.
Example Problem :
Use the following variables as an example problem to test your knowledge.
upper class boundary/limit (UL) = 10
lower class boundary/limit (LL) = 8
class size (CS) = UL − LL = 10 − 8 = 2
FAQs
What is the significance of calculating Class Size in data analysis?
Calculating class size (class width) is important when building grouped frequency tables and histograms. The chosen width determines how data are grouped into intervals, which can affect how clearly patterns, clusters, and outliers are revealed in summaries and plots.
Can Class Size affect the accuracy of statistical results?
Yes. When data are grouped into classes, using very wide classes can hide important structure, while very narrow classes can produce a noisy-looking histogram and unstable grouped summaries. A reasonable class width helps balance detail and readability.
How do you choose the right upper and lower limits for calculating Class Size?
It depends on what you are calculating. For the width of a single class, UL and LL should be the upper and lower boundaries (or limits) of that class interval. If you are designing classes from scratch, you typically start from the dataset’s minimum and maximum values to find the range, choose a number of classes, then compute an initial class width (range ÷ number of classes) and adjust it to a convenient value so the full set of class intervals covers all observations.