Calculate the coefficient of variation (CV) from a data set or from a known mean and standard deviation, and compare the variability of two data sets as a percentage.
Coefficient of Variation Formula
The coefficient of variation expresses the standard deviation as a percentage of the mean. It lets you compare the spread of data sets that have different units or very different averages.
CV = (s / x̄) * 100
When you work with a full population, you use the population standard deviation instead of the sample standard deviation:
CV = (σ / μ) * 100
The standard deviation itself comes from the variance. The sample version divides by n - 1 and the population version divides by n:
s = sqrt( Σ(xᵢ - x̄)² / (n - 1) )
σ = sqrt( Σ(xᵢ - μ)² / n )
For small samples, the advanced option applies a bias correction that nudges the estimate upward:
CV* = CV * (1 + 1 / (4n))
Where:
- CV is the coefficient of variation, reported as a percentage.
- s is the sample standard deviation, and σ is the population standard deviation.
- x̄ is the sample mean, and μ is the population mean.
- xᵢ is each individual value in the data set.
- n is the number of values in the data set.
- CV* is the small-sample (unbiased) corrected coefficient of variation.
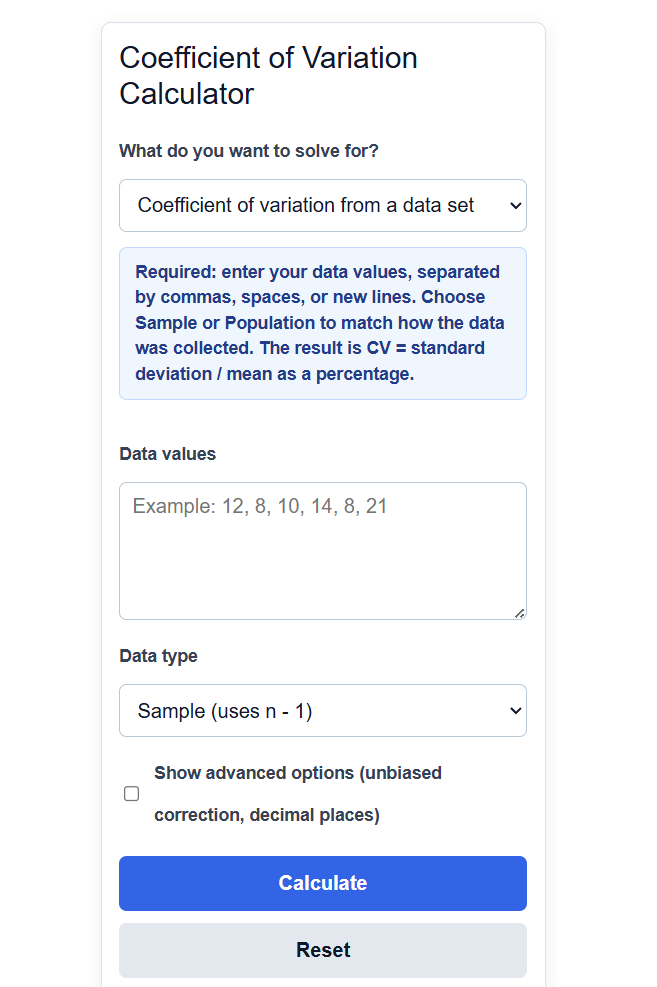
The calculator runs in three modes. The data set mode reads the values you type, finds the mean and standard deviation for you, and returns the CV. The mean and standard deviation mode takes those two numbers directly when you already know them. The compare mode runs the calculation on two data sets and tells you which one is more variable. The data type selector switches between the sample formula (n - 1) and the population formula (n), and the advanced toggle adds the small-sample correction and lets you set the number of decimal places.
Interpreting the Coefficient of Variation
A higher CV means more relative spread around the mean. There is no universal cutoff, but the ranges below are a common rule of thumb for how consistent a data set is.
| Coefficient of Variation | Relative Variability |
|---|---|
| Below 10% | Low spread, very consistent data |
| 10% to 20% | Moderate spread |
| 20% to 30% | High spread |
| Above 30% | Very high spread, inconsistent data |
The next table shows which formula to choose based on what your numbers represent.
| Your Data | Use | Divisor |
|---|---|---|
| A subset drawn from a larger group | Sample | n - 1 |
| Every member of the group | Population | n |
Example Problems
Example 1. You have the sample data set 12, 8, 10, 14, 8, 21. The mean is 12.167. The sample standard deviation (using n - 1) is about 4.875. The coefficient of variation is:
CV = (4.875 / 12.167) * 100 = 40.07%
A CV above 30% tells you this data is quite spread out relative to its average.
Example 2. A process has a known mean of 50 and a standard deviation of 7.5. You already have both numbers, so you use the mean and standard deviation mode:
CV = (7.5 / 50) * 100 = 15%
A CV of 15% points to moderate, fairly controlled variability.
Frequently Asked Questions
Why use the coefficient of variation instead of the standard deviation?
The standard deviation is in the same units as your data, so you cannot fairly compare the spread of, say, heights in centimeters against weights in kilograms. The coefficient of variation removes the units by dividing by the mean, which gives you a percentage you can compare across data sets that are measured differently or have very different averages.
Should I use the sample or population formula?
Use the population formula (divide by n) only when your numbers include every member of the group you care about. If your data is a sample taken from a larger group, use the sample formula (divide by n - 1), which corrects for the tendency of small samples to underestimate spread. When in doubt, the sample formula is the safer choice.
When is the coefficient of variation not useful?
The CV is unreliable when the mean is near zero, because dividing by a tiny mean inflates the result, and it loses its meaning entirely when the mean is exactly zero. It also works best on ratio-scale data with a true zero point. For data that can be negative or that sits on an interval scale, such as temperature in Celsius, the coefficient of variation can be misleading.