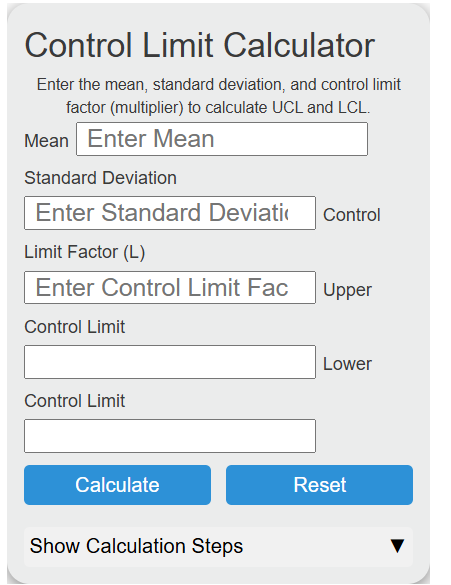
Calculate upper and lower control limits from the mean, standard deviation, and control limit factor for statistical process control.
Control Limit Formula
The following formula can be used to calculate the upper and lower control limits.
LCL = x - (l*s)
UCL = x + (l*s)
- Where LCL is the lower limit
- UCL is the upper limit
- x is the mean
- s is the standard deviation
- l is the control limit factor (multiplier)
Control Limit (Data) Definition
The control limit is a statistical concept used in quality control to assess the variation and performance of data within a process. It represents the boundaries within which data points are expected to fall under normal circumstances.
These limits are defined using statistical calculations based on historical data and are used to monitor and maintain the stability and predictability of a process.
Control limits are typically set at a fixed number of standard deviations from the mean of the data.
The upper control limit (UCL) is calculated by adding a certain number of standard deviations to the mean, while the lower control limit (LCL) is obtained by subtracting the same number of standard deviations from the mean.
This establishes a range within which data points are considered expected and acceptable.
The importance of control limits lies in their ability to help organizations identify variation beyond what is considered normal, known as special cause variation.
When data points fall outside the control limits, the process may have experienced a significant change or a special cause that needs to be investigated. This indicates that the process is no longer stable and predictable, which may lead to defects, errors, or deviations from desired outcomes.
Control Limit Example
How to calculate control limit?
- First, determine the mean.
Measure or calculate the mean of the data.
- Next, determine the standard deviation.
Calculate the standard deviation of the data.
- Next, choose the control limit factor (multiplier).
Select the control limit factor (L), commonly 3 for ±3σ limits.
- Finally, calculate the upper and lower bounds.
Calculate the upper and lower bounds using the formula above.
FAQ
What is the difference between control limits and specification limits?
Control limits are statistically determined boundaries used in process control, while specification limits are set based on customer requirements or industry standards and define the acceptable range of product specifications.
How do you calculate control limits?
Control limits are calculated using the mean and standard deviation of the data, along with a multiplier (control limit factor) that determines the distance of the limits from the mean. The formula for the lower control limit (LCL) is LCL = mean – (control limit factor * standard deviation), and the formula for the upper control limit (UCL) is UCL = mean + (control limit factor * standard deviation).
Why are control limits important in quality control?
Control limits are crucial for monitoring process stability and identifying when a process is out of control. By analyzing data points in relation to these limits, organizations can detect unusual variations early and take corrective actions to maintain product quality and process efficiency.
Can control limits change over time?
Yes, control limits can change over time as processes improve or deteriorate, or as more data becomes available. It’s important to regularly review and adjust control limits based on recent data to ensure they accurately reflect the current state of the process.