Calculate t statistics, degrees of freedom, and one- or two-tailed p-values for one-sample, Welch or pooled independent, and paired-sample t tests.
- All Statistics Calculators
- Welch's T-Test Calculator
- Z-Score Calculator
- Difference of Means Calculator
- Standard Error of Difference Calculator
- Coefficient of Skewness Calculator
T Statistic Formula
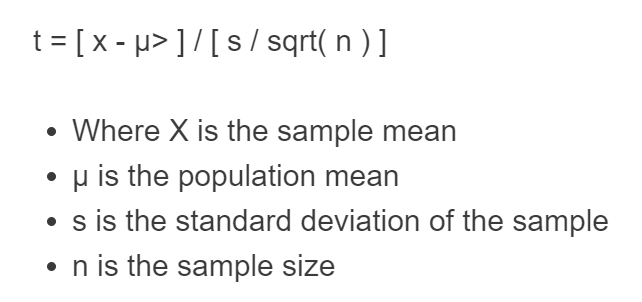
The following one-sample formula compares a sample mean with a hypothesized null mean, using the estimated standard error of the sample mean.
- Where x̄ is the sample mean
- μ₀ is the hypothesized null mean of the population
- s is the standard deviation of the sample
- n is the sample size
For one sample, subtract the hypothesized null mean from the sample mean, then divide by s / √n. A positive t means the sample mean is above that null value; a negative t means it is below.
The most important point to note about this formula is that the standard deviation is of the sample, not the entire population.
Keep the subtraction order consistent. One-sample t uses sample mean minus null mean; independent t uses Group 1 mean minus Group 2 mean minus the hypothesized difference; paired t uses the mean of consistently ordered pair differences minus the hypothesized paired difference.
Choose one-sample, independent two-sample, or paired mode. Independent mode offers Welch’s unequal-variance standard error and degrees of freedom, or a pooled calculation that assumes equal population variances. Paired mode requires the mean and sample SD of the differences, not the separate before/after SDs; form every pair difference in the same order. Blank hypothesized independent or paired differences mean zero. The one-sample null mean must be supplied. Counts must be whole numbers of at least 2, and all supplied sample SDs must be positive. These definitions follow the NIST TTEST reference.
One-sample and paired tests use df = n - 1. Pooled independent tests use df = n₁ + n₂ - 2; Welch uses Welch–Satterthwaite degrees of freedom. Select the right, left or two-sided alternative in the stated subtraction direction. P-values use Student-t tail probabilities under the null and the test assumptions; a small p-value is not proof of an effect, its practical importance, or the probability that the null is true. Appropriate sampling, independence and distributional conditions remain necessary, and cannot be checked from these summary inputs alone. For paired inference, those conditions concern the pair differences. The numerical probability routine supports positive df up to 1,000,000 and reports unsupported ranges or nonconvergence. A reported log probability preserves information when an ordinary floating-point probability underflows.
Any displayed null-adjusted standardized difference is descriptive: the null-adjusted difference divided by a sample SD reference. Independent mode uses the pooled sample SD as this descriptive reference even when Welch’s method supplies the test standard error and degrees of freedom. This does not change Welch’s test or establish equal variances, and the number is not automatically Cohen’s d or a required universal effect-size measure.
T Statistic Definition
A t statistic expresses a null-adjusted estimated difference in units of its estimated standard error. Its sign follows the subtraction order; it is not a measure of sample accuracy.
How to calculate t statistic?
Example Problem:
First, determine the sample mean. For this example problem, the sample mean is found to be 45.
Next, specify the hypothesized null mean. In this example, the null mean is 50; it is a hypothesis value, not a population mean calculated from this sample.
Next, determine the standard deviation of the sample. For this problem, the standard deviation of the sample (important to note this is not the standard deviation of the population) is found to be 2.5.
Next, determine the sample size. The sample size for this example is 400.
Finally, calculate the t-statistic using the formula above:
t = (sample mean - null mean) / (s / √n)
t = (45 - 50) / (2.5 / √400) = -5 / 0.125
t = -40
FAQ
A t statistic is an estimated difference from a hypothesized value divided by its estimated standard error. Its sign follows the subtraction order; its magnitude reports how many estimated standard errors the difference lies from the null value. It is not a measure of sample accuracy.
How to calculate a t statistic
- First, determine the sample mean
Calculate the sample mean of the data set
- Next, specify the hypothesized null mean
Specify the null mean stated by the hypothesis; it need not be a known or calculated mean of the entire population.
- Calculate the standard deviation of the sample
Use the formula for standard deviation
- Finally, calculate the t-statistic
Using the values from steps 1-3 and the sample size, calculate the t-statistic through the formula above.
Formula graphic note: the correct one-sample statistic is t = (x̄ - μ₀) / (s / √n), with μ₀ the hypothesized null mean. The retained illustration’s extra > symbol after x - μ is a graphic error, not part of the formula.