Calculate the average star rating using any number of maximum stars.
- All Statistics Calculators
- Average of Percentages Calculator
- Weighted Mean Calculator
- Average Point Score Calculator
- Percentage Calculator
- Inter-Rater Reliability Calculator
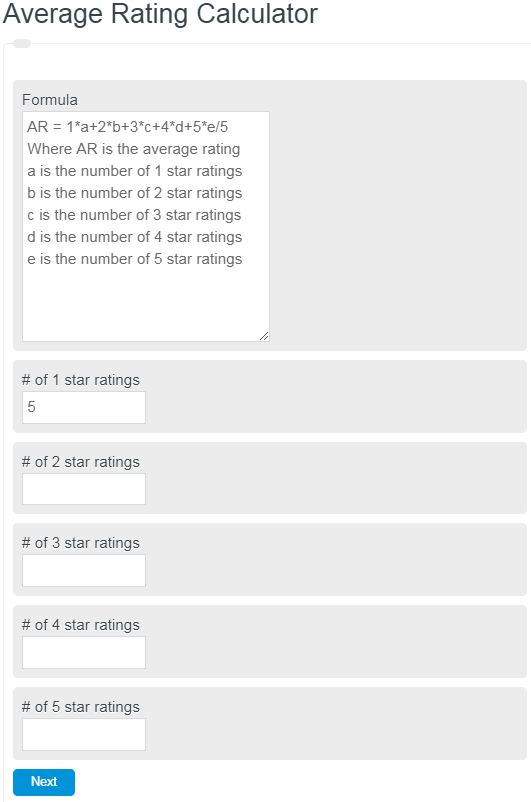
Average Rating Formula
The average star rating is a weighted average where each star level is multiplied by the number of votes it received, then divided by the total number of votes.
Where AR is the average rating, and R1 through R5 represent the count of votes at each star level. This differs from a simple arithmetic mean because each rating category carries a different weight proportional to its star value. A product with 100 five-star ratings and 50 one-star ratings does not average to 3.0 stars. Instead: (100 x 5 + 50 x 1) / 150 = 3.67 stars.
Why Star Ratings Follow a J-Shaped Distribution
Star rating distributions are almost never bell-shaped. Across platforms like Amazon, Google, and Yelp, ratings consistently form a J-shaped curve where 5-star ratings dominate, 1-star ratings form a secondary peak, and the middle stars (2, 3, 4) are underrepresented. This pattern occurs because people who feel strongly are the most motivated to leave a review. Customers with moderate experiences tend to stay silent. On Amazon, roughly 60% of all product ratings are 5 stars, while 1-star ratings typically account for 10 to 15% of the total. The 2-star and 3-star categories often combine for less than 15% of all reviews.
This distribution pattern means that even small changes in the proportion of low ratings can significantly drag down an average. A product shifting from 5% one-star reviews to 12% one-star reviews can see its average drop from 4.6 to 4.1, a difference that crosses critical consumer thresholds.
Average Star Ratings by Industry
Average ratings vary substantially by sector. Restaurant reviews on Google Maps average approximately 3.9 stars, while the same restaurants on delivery platforms average only 2.7 stars due to the added friction of delivery delays and order accuracy issues. E-commerce products on major platforms tend to cluster between 4.1 and 4.5 stars when they have more than 50 reviews. Mobile apps on the App Store average around 4.5 stars for the top charts, but the median app across all categories sits closer to 3.0. Hotels on major booking platforms average between 3.8 and 4.2 stars. Software products on review platforms like G2 and Capterra average between 4.2 and 4.5 stars, partly because vendors actively solicit reviews from satisfied customers.
The Bayesian Average: A Better Approach for Small Sample Sizes
A simple weighted average becomes unreliable when the number of ratings is small. A product with two 5-star reviews shows a perfect 5.0 average, but that tells you far less than a product with 500 reviews averaging 4.7. The Bayesian average solves this by pulling ratings toward a global mean until enough votes accumulate to let the item's own data dominate.
IMDb uses a version of this for its Top 250 list: WR = (v / (v + m)) x R + (m / (v + m)) x C, where v is the number of votes, R is the average rating, m is the minimum vote threshold (currently 25,000), and C is the mean rating across all titles (approximately 7.0). A film with only 100 votes and a 9.5 average would be pulled heavily toward the 7.0 global mean, while a film with 500,000 votes at 8.5 stays close to its own average.
The Wilson Score Interval takes a different approach by computing a confidence interval around the observed rating and using the lower bound as the ranking value. This method is particularly useful for binary systems (upvote/downvote) and accounts for sample size naturally. Reddit adopted the Wilson score to surface quality comments even when they have fewer votes than lower-quality popular comments.
Consumer Psychology of Star Ratings
Research shows that 77% of consumers will only purchase from businesses rated 4.5 stars or higher. A shift of just 0.3 stars can measurably change sales volume, return rates, and customer loyalty. However, a perfect 5.0-star rating actually generates suspicion. Products rated between 4.5 and 4.9 consistently outperform perfect-rated products in traffic and conversion because consumers interpret a perfect score as potentially manipulated or based on too few reviews.
How a rating is displayed also matters. Research from the University of South Florida found that consumers perceive a 3.5 numerical rating as lower than the same 3.5 displayed as stars. This is caused by left-digit anchoring: when people see the number 3.5, they fixate on the leading digit 3. This finding suggests that businesses benefit from displaying ratings in star or shape format rather than purely numerical form.
Negativity bias also plays a role. Studies analyzing large review datasets have found that negative sentiments in review text exert a stronger influence on the star rating a reviewer assigns than positive sentiments of equal magnitude. A single frustrating experience with shipping can outweigh multiple satisfying product interactions when a customer selects a star count.
Rating Manipulation and Detection
Fake reviews are a persistent problem across all rating platforms. Estimates suggest that between 10% and 30% of online reviews are fraudulent. Common red flags include a sudden burst of 5-star reviews over a short period, reviews that are unusually short or vague, reviewer profiles with no history, and a bimodal distribution with nothing in between 5-star and 1-star reviews. Platforms increasingly use machine learning to flag suspicious patterns, analyzing the timing, language, and behavioral signatures of review authors.
Alternatives to the 5-Star System
Not all platforms use a 5-star scale. Netflix switched from a 5-star system to a binary thumbs-up/thumbs-down model in 2017, increasing rating participation by over 200%. Rotten Tomatoes uses a dual percentage system: the Tomatometer and the Audience Score. IMDb uses a 10-point scale, which offers finer granularity but introduces grade inflation where most ratings cluster between 6 and 8. Steam uses a positive/negative binary combined with aggregate thresholds (Overwhelmingly Positive, Very Positive, Mixed, etc.). Each system has trade-offs between simplicity, participation rate, granularity, and resistance to manipulation.
FAQ
An average rating is the weighted mean of all individual star ratings received by a product, service, or entity. It is calculated by multiplying each star level by the number of votes at that level, summing the results, and dividing by the total number of votes.
Most platforms and researchers consider 30 ratings a minimum for basic reliability. IMDb requires 25,000 votes for its Top 250 list. Consumer trust in a rating increases significantly once a product crosses approximately 50 reviews.
Consumers interpret a perfect 5.0-star rating with suspicion, assuming the reviews may be faked or based on too few votes. Products rated between 4.5 and 4.9 generate more traffic and higher conversion rates because the range signals quality while appearing authentic.
A Bayesian average adjusts a raw average by pulling it toward a global mean based on how many votes have been received. Items with few votes are weighted heavily toward the overall average, while items with many votes reflect their own rating more closely.