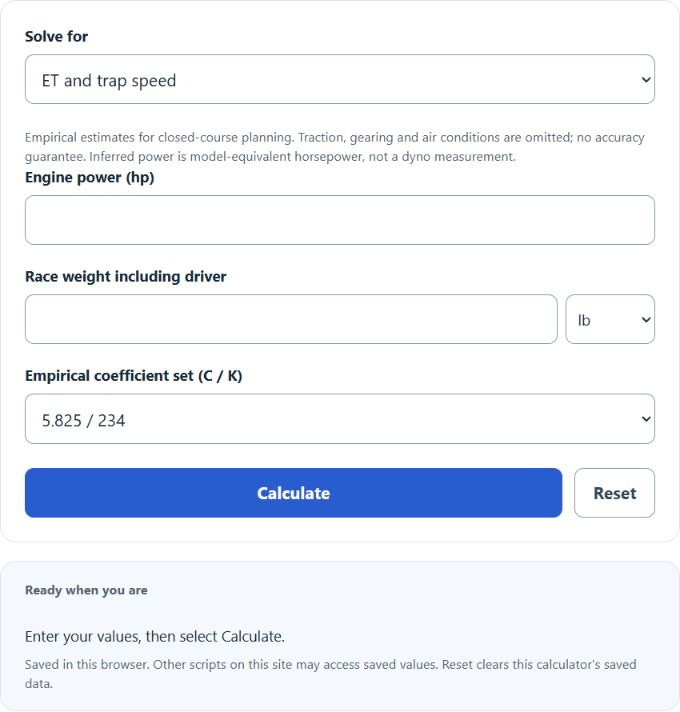
Calculate your predicted 1/4 and 1/8 mile ET and trap speed from horsepower and weight, estimate power from a run, and project ET after car changes.
Drag Racing ET Predictor Formula
ET = C * (W / P)^(1/3)
MPH = K * (P / W)^(1/3)
ET_new = ET_base * ((W_new / W_old) * (P_old / P_new))^(1/3)
- ET is the predicted 1/4-mile elapsed time in seconds
- MPH is the predicted 1/4-mile trap speed in miles per hour
- W is the vehicle weight including the driver in pounds
- P is the engine power in horsepower
- C and K are legacy empirical coefficient choices: 5.825 / 234, 6.269 / 230 and 6.290 / 224. The mean option uses the arithmetic mean of C and K. These sets are estimates, not calibrated guarantees for an individual vehicle.
- ET_new is the projected elapsed time after a weight or power change, scaled from a real baseline run (ET_base)
The first two formulas estimate quarter-mile ET and trap speed from race weight and horsepower. The inverse uses P = W × (C / ET)³; the mean option inverts the mean C exactly. The adjustment formula scales a measured baseline assuming comparable traction, gearing and conditions. Eighth-mile estimates use retained rough factors of 1.56 for ET and 1.26 for speed, multiplying toward a quarter mile and dividing in reverse. Neither factor is an exact conversion law; these estimates do not guarantee a dial-in.
Power-to-Weight Benchmarks and ET Adjustment Rules
The table below shows typical 1/4-mile results at common power-to-weight ratios using Hale’s constants. Divide race weight (with driver) by horsepower to find your row.
| Power-to-weight (lb/hp) | Typical 1/4-mile ET | Typical trap speed |
|---|---|---|
| 4 | 9.25 s | 147 mph |
| 6 | 10.58 s | 129 mph |
| 8 | 11.65 s | 117 mph |
| 10 | 12.55 s | 109 mph |
| 12 | 13.34 s | 102 mph |
| 15 | 14.37 s | 95 mph |
| 20 | 15.81 s | 86 mph |
These rules of thumb show how common changes move the ET of a car running around 12 seconds. They come from the cube-root scaling formula, so larger or smaller cars shift proportionally.
| Change | Approximate ET effect |
|---|---|
| Remove 100 lb (3,500 lb car) | About 0.11 s quicker |
| Add 10 hp (400 hp car) | About 0.10 s quicker |
| Add 25 hp (400 hp car) | About 0.24 s quicker |
| Add a 180 lb passenger (3,500 lb car) | About 0.20 s slower |
How to Predict Drag Racing ET
Example one: predict the ET of a 3,400 lb car (with driver) making 450 horsepower. The power-to-weight ratio is 3400 / 450 = 7.56 lb/hp. Using Hale’s formula, ET = 5.825 * (7.56)^(1/3) = 11.43 seconds, and trap speed = 234 * (450 / 3400)^(1/3) = 119.3 mph. On an 1/8-mile track the same car predicts 11.43 / 1.56 = 7.33 seconds at about 94.6 mph.
Example two: project a new ET after removing weight. A car with a baseline of 12.20 seconds at 3,600 lb sheds 150 lb, giving a new weight of 3,450 lb. ET_new = 12.20 * (3450 / 3600)^(1/3) = 12.03 seconds, a gain of about 0.17 seconds without touching the engine.
FAQ
Why can real ET differ from the prediction?
Traction, gearing, power delivery, shift time, aerodynamic drag and atmospheric conditions affect actual runs. ET and trap speed alone do not uniquely diagnose a power or launch problem. Treat these formulas as rough estimates under comparable conditions.
Which coefficient set should I choose?
Compare each legacy empirical set against measured runs for the same vehicle. The mean is a summary of the selected coefficients, not a confidence interval or expected accuracy range. Historical attributions do not establish that a set is appropriate for a particular car.
What weight and horsepower should I enter?
Use vehicle race weight including the driver and fuel. The calculator reports model-equivalent horsepower; it cannot convert a wheel-dyno reading to flywheel power with a universal loss percentage. Keep the power basis consistent when comparing changes. A measured dyno result and an ET-inferred estimate answer different questions.