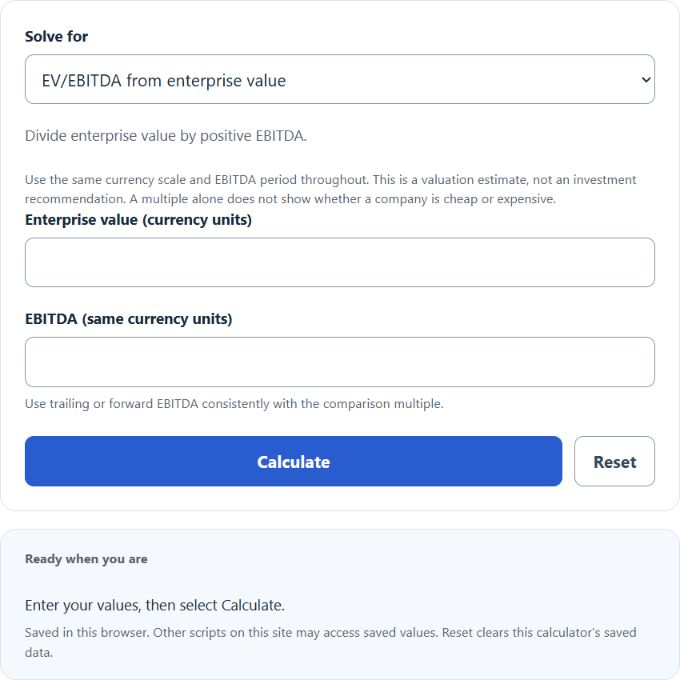
Calculate a company’s EV/EBITDA multiple, or apply an industry multiple to EBITDA to estimate implied enterprise value, equity value, and value per share.
EV/EBITDA Multiple Formula
EV/EBITDA = EV / EBITDA
EV = MC + TD + PS + MI - C
Implied EV = EBITDA * Multiple
- EV/EBITDA is the enterprise value to EBITDA multiple (expressed as a number of times, such as 8x)
- EV is enterprise value ($); this simplified build uses market values for equity and preferred stock, and debt market value when available and materially different from book value
- EBITDA is earnings before interest, taxes, depreciation, and amortization ($)
- MC is market capitalization ($)
- TD is total interest-bearing debt, both short-term and long-term ($)
- PS is preferred stock ($)
- MI is minority interest ($)
- C is cash and cash equivalents ($)
The calculator supports three tasks through four solve choices. For the multiple task, it divides enterprise value by EBITDA to return the multiple, and you can either enter enterprise value directly or build it from market capitalization, debt, cash, and the optional preferred stock and minority interest components. For implied valuation, it multiplies EBITDA by a multiple you select to return an implied enterprise value, and it can extend that result to an implied equity value by subtracting net debt and to a value per share by dividing by shares outstanding. This simplified common-equity bridge assumes no preferred stock, minority claims or other adjustments. For required EBITDA, it divides a target enterprise value by an expected multiple to return the EBITDA the business would need to generate to justify that valuation.
Choosing an EV/EBITDA Multiple
Select dated comparable-company or transaction evidence using the same EBITDA period and accounting basis. There is no universal fair multiple or industry range: growth, risk, reinvestment and deal terms matter. Public-company sector averages do not establish private-company transaction values. Any multiple entered here is your valuation assumption.
Example Problems
Example 1: computing the multiple. A company has a market capitalization of $1,000 million, total debt of $400 million, and cash of $200 million. Enterprise value is 1,000 + 400 - 200 = $1,200 million. With EBITDA of $150 million, the EV/EBITDA multiple is 1,200 / 150 = 8.0x. Whether that is a suitable valuation requires dated, comparable evidence.
Example 2: implied valuation. Suppose a business generates $25 million of EBITDA and you assume a hypothetical 6.5x multiple. The implied enterprise value is 25 x 6.5 = $162.5 million. If the company carries $40 million of net debt, the implied equity value is 162.5 - 40 = $122.5 million, assuming no preferred stock, minority claims or other equity-bridge adjustments.
FAQ
Why use EV/EBITDA instead of the P/E ratio? EV/EBITDA compares the value of the whole business, debt included, to earnings before interest, taxes, depreciation and amortization. EBITDA is not free cash flow and omits capital spending and working-capital needs. That makes it possible to compare companies with different debt levels, tax situations, and depreciation policies, which the P/E ratio cannot do cleanly. It is the standard multiple in M&A and leveraged buyout analysis for exactly this reason.
What if EBITDA is negative? This calculator requires positive EBITDA for conventional EV/EBITDA comparisons and positive-multiple valuation scenarios. Zero EBITDA makes the ratio undefined; negative EBITDA generally makes this comparison unsuitable. A small positive denominator can produce a large, unstable multiple. For unprofitable companies, analysts switch to a revenue multiple (EV/Revenue) or a forward EBITDA estimate once the business is expected to turn profitable.
Should I use trailing or forward EBITDA? Both are valid as long as you are consistent. Trailing twelve months EBITDA is factual but backward looking, while forward EBITDA reflects expected performance and typically produces a lower multiple for a growing company. When comparing your result to industry benchmarks, make sure the benchmark uses the same basis, since mixing trailing and forward or adjusted and unadjusted figures distorts the comparison.