Calculate a missing X or Y value by extrapolating from two known points, X1,Y1 and X2,Y2, plus a third coordinate on a linear trend.
- All Statistics Calculators
- Interpolation Calculator
- Double Interpolation Calculator
- Direct Variation Calculator
- Joint Variation Calculator
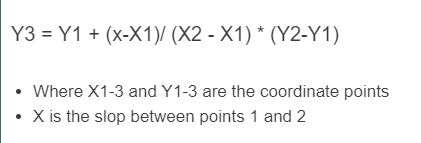
Extrapolation Formula
The linear extrapolation formula solves for a third point on the line defined by two known coordinate pairs:
- (X1, Y1) and (X2, Y2): two known coordinate pairs that define the trend line
- X3: input value outside the known range for which Y3 is predicted
- Slope m = (Y2 – Y1) / (X2 – X1): assumed constant beyond the known range
- To solve for X3 given Y3: X3 = X1 + ((Y3 – Y1) / m)
Types of Extrapolation
| Type | Method | Points Required | Best Used When |
|---|---|---|---|
| Linear | Extends a straight line beyond two known points using constant slope | 2 | Data shows a consistent, constant rate of change |
| Polynomial | Fits a polynomial curve through multiple points and extends it | 3 or more | Data follows a smooth nonlinear trend (quadratic, cubic, etc.) |
| Conic | Fits a conic section (circle, ellipse, parabola, or hyperbola) to five points | 5 | Data curves sharply and approaches a conic boundary |
Prediction error grows with distance from the known data range. Estimates within 10-20% of the x-range span are generally reliable; beyond 50%, linear assumptions should be independently validated.
Extrapolation vs. Interpolation
| Feature | Extrapolation | Interpolation |
|---|---|---|
| Estimate location | Outside the known data range | Between known data points |
| Reliability | Decreases with distance from data | Generally high within range |
| Core assumption | Trend continues beyond measured data | Trend exists between measured data points |
| Error risk | Higher; model may not hold outside the range | Lower; constrained by known values on both sides |
| Primary use | Forecasting, future projection | Gap-filling, missing value estimation |
Applications by Field
| Field | Extrapolation Use |
|---|---|
| Finance | Yield curve extension beyond last traded maturity; forward rate projection |
| Demographics | Population forecasting between and beyond census intervals |
| Climate science | Temperature anomaly projection from historical baselines; sea level rise estimation |
| Engineering | Predicting material fatigue beyond laboratory test parameters |
| Astronomy | Calculating future planetary positions from observed orbital data |
| Medicine | Estimating drug plasma concentration outside the sampling window |
Extrapolation Accuracy
For a simple two-point linear model, prediction uncertainty at a new point X3 scales with the squared distance from the center of the known x-range. Doubling the distance from the data roughly quadruples prediction error variance, meaning short-range extrapolations carry much less risk than long-range projections.
A well-documented case of extrapolation failure: a 1894 newspaper projection extrapolated London’s horse population linearly and concluded the city would be buried under 9 feet of manure by 1950. The assumption of continued linear growth was invalidated within a decade by the adoption of motorized transport. Extrapolation is only as valid as the assumption that the observed trend holds outside the measured range.
FAQ
Extrapolation is the process of estimating a value outside the range of known data points by extending the observed trend. In the linear case, it assumes the slope between two known points continues at the same rate beyond either endpoint. It is used across finance, demographics, climate science, and engineering to project future or unknown values.
Interpolation estimates values between known data points (inside the known range), while extrapolation estimates values beyond the known range. Interpolation is more reliable because the estimate is constrained by data on both sides. Extrapolation carries higher uncertainty since the assumed trend may not hold outside the observed data.
Linear extrapolation becomes unreliable when: (1) the underlying relationship is nonlinear, (2) the prediction point is far beyond the known data range (generally beyond 20-50% of the range span), or (3) a structural change occurs in the data-generating process. Population growth, asset prices, and material stress all commonly deviate from linear behavior at extremes.
The three types are: (1) Linear, which extends a straight line from two known points; (2) Polynomial, which fits a polynomial curve through three or more points and extends it beyond the known range; and (3) Conic, which fits one of four conic sections through five known points. Linear extrapolation is the most widely used.
Richardson extrapolation is a numerical method that combines estimates at different step sizes to produce a more accurate result. By eliminating leading error terms, it improves approximations to derivatives and integrals. It is used in finite difference methods and numerical integration to accelerate convergence without reducing step size.