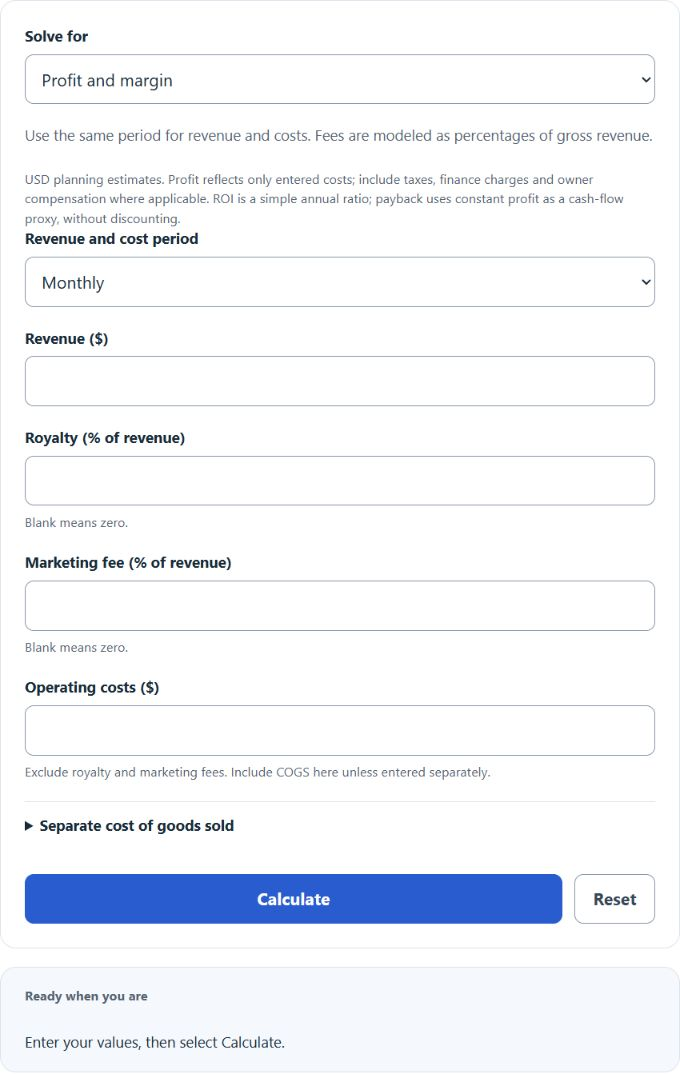
Calculate franchise profit and margin from revenue, royalty and marketing fees, plus ROI, payback period, and the revenue needed to hit a target profit.
Franchise Profit Formula
- FP is the franchise net profit ($)
- FR is the franchise revenue for the period ($)
- RF is the royalty fee (% of revenue)
- MF is the marketing or brand fund fee (% of revenue)
- COGS is the cost of goods sold ($), if entered separately
- OC is all other operating costs for the same period ($)
The calculator has three modes. The profit mode applies the formula above: it converts the royalty and marketing percentages into dollar amounts, subtracts them along with your costs, and reports net profit and net profit margin. If you enter cost of goods sold separately under the advanced option, it also shows a gross profit line.
The target-profit mode reverses the formula to find the revenue you need:
- REV is the required revenue ($)
- TP is the target net profit ($)
- FC is the fixed costs for the period ($)
- VC is variable costs as a percent of revenue (%)
Setting TP to zero in this formula gives the breakeven revenue, which the calculator reports alongside the required revenue.
The ROI mode provides a simple annual profit-to-investment ratio and a constant-profit payback proxy. Neither is a forecast, discounted return or cash-flow analysis:
- ROI is the annual return on investment (%)
- AP is the annual net profit ($)
- I is the total initial investment ($)
Hypothetical Franchise Fee Scenarios
The ranges below are illustrative scenarios, not verified industry averages or recommended inputs. Use the current brand-specific FDD: Item 5 covers initial fees; Item 6 lists ongoing fees, their bases and terms. Actual agreements may include fixed amounts, minimums, caps or tiering that this constant-percentage model does not represent.
| Industry | Hypothetical royalty fee | Hypothetical marketing fee |
|---|---|---|
| Fast food / QSR | 4% – 8% | 2% – 4% |
| Full-service restaurants | 4% – 6% | 1% – 3% |
| Fitness and gyms | 5% – 7% | 1% – 2% |
| Home services and cleaning | 5% – 10% | 1% – 2% |
| Hotels | 4% – 6% | 1% – 3% |
| Retail | 4% – 6% | 1% – 3% |
| Senior and child care | 4% – 6% | 1% – 2% |
The following table translates simple constant-profit payback into its reciprocal annual ROI. It does not rank franchise opportunities. Accounting profit may differ from cash flow, and timing, risk, taxes and resale value are not represented.
| Payback period | Interpretation |
|---|---|
| Under 2 years | Above 50% simple annual ROI in this constant-profit model |
| 2 – 3 years | About 33.3%–50% simple annual ROI |
| 3 – 5 years | About 20%–33.3% simple annual ROI |
| 5 – 7 years | About 14.3%–20% simple annual ROI |
| Over 7 years | Below about 14.3% simple annual ROI |
Franchise Profit Example Problems
Example 1: monthly net profit. A sandwich franchise brings in $60,000 in monthly revenue. The royalty fee is 6%, the marketing fee is 2%, and total operating costs, including food and labor, are $48,000 per month.
Royalty fee = 60,000 * 0.06 = $3,600. Marketing fee = 60,000 * 0.02 = $1,200.
FP = 60,000 – 3,600 – 1,200 – 48,000 = $7,200 per month, a net profit margin of 12%. Annualized, that is $86,400.
Example 2: revenue needed for a target profit. You want $10,000 in monthly profit from a franchise with a 6% royalty, a 2% marketing fee, variable costs of 55% of revenue, and fixed costs of $15,000 per month.
The combined percentage costs are 6 + 2 + 55 = 63%, so you keep $0.37 of each sales dollar.
REV = (10,000 + 15,000) / 0.37 = $67,567.57 in required monthly revenue. Breakeven revenue is 15,000 / 0.37 = $40,540.54.
Franchise Profit FAQs
Are royalty fees charged on gross sales or on profit? Many franchise agreements base royalties on gross revenue, and royalties may still be due while the location loses money. Check the actual contract and Item 6 rather than assuming every agreement uses the same base. This calculator assumes the entered royalty and marketing percentages apply to gross revenue.
What is a good net profit margin for a franchise? There is no universal margin that establishes whether a franchise is a good investment. Compare like-for-like costs and periods using substantiated brand-specific performance information, when available in Item 19, and assess cash flow and risk separately. Some franchises never break even.
Where do I find realistic revenue and cost numbers to enter? The Franchise Disclosure Document is the primary source. Item 19 may contain a Financial Performance Representation; it is not mandatory. Read its population, time period, assumptions and limitations. Item 7 lists estimated initial investment, Item 5 covers initial fees, and Item 6 covers ongoing fees. Discuss actual costs and experiences with current and former franchisees.