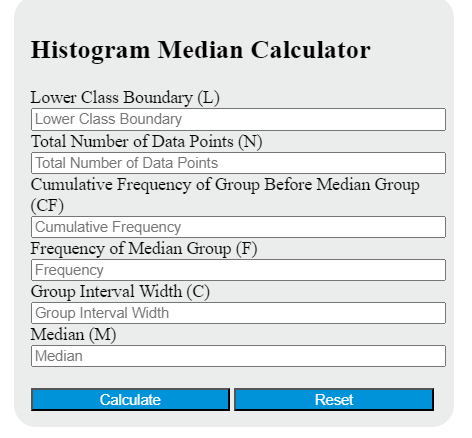
Enter the lower class boundary, number of data points, cumulative frequency, frequency of median group, and group interval width to determine the median.
Histogram Median Formula
The following formula is used to calculate the median of a histogram.
M = L + ( (N/2 - CF) / F ) * C
Variables:
- M is the median of the histogram
- L is the lower class boundary of the group containing the median
- N is the total number of data points
- CF is the cumulative frequency of the group before the median group
- F is the frequency of the median group
- C is the width of the group interval
What is a Histogram Median?
A histogram median is a value that divides a histogram into two equal areas. It is the middle value of a data set, separating the data into two halves. In a histogram, it is represented by the point at which the area under the curve to the left equals the area under the curve to the right. It is a measure of central tendency that gives a good idea of the central location of the data, especially when the data set is skewed or contains outliers.
How to Calculate Histogram Median?
The following steps outline how to calculate the Histogram Median.
- First, determine the lower class boundary of the group containing the median (L).
- Next, determine the total number of data points (N).
- Next, determine the cumulative frequency of the group before the median group (CF).
- Next, determine the frequency of the median group (F).
- Finally, determine the width of the group interval (C).
- After inserting the variables into the formula M = L + ((N/2 – CF) / F) * C, calculate the Histogram Median.
Example Problem:
Use the following variables as an example problem to test your knowledge.
Lower class boundary (L) = 20
Total number of data points (N) = 100
Cumulative frequency of the group before the median group (CF) = 40
Frequency of the median group (F) = 10
Width of the group interval (C) = 5
