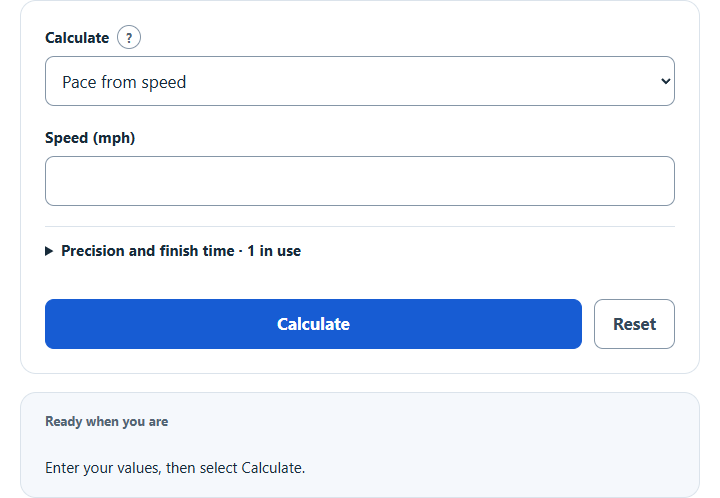
Convert mph to minutes per mile for running, walking or cycling, with pace per km and race finish times, or convert a minutes-per-mile pace back to mph.
Calculator Functions
| Function | What it does | What it requires |
|---|---|---|
| Pace from speed | Converts a speed in mph to a pace in minutes and seconds per mile | Requires the speed in mph |
| Speed from pace | Converts a pace per mile to a speed in mph | Requires the pace in minutes and seconds per mile |
Both functions also show the pace per kilometer, the speed in km/h and m/s, and the finish time at that constant pace for 1 mile, 5K, 10K, 10 miles, a half marathon and a marathon. Optional settings change the speed from 2 decimal places to 1 or 3 and add the finish time for a custom distance in miles or kilometers.
mph to Minutes Per Mile Formulas
| MPM | Pace, the time it takes to cover one mile (minutes) |
| MPH | Speed (miles per hour) |
| 60 | Minutes in one hour |
The decimal part of the answer is a fraction of a minute, not a number of seconds. 7 mph is 60 ÷ 7 = 8.571 minutes per mile, and 0.571 of a minute is 34 seconds, so the pace is 8:34. Results are rounded to the nearest second.
Pace from speed
The main formula applies directly. 4 mph is 60 ÷ 4 = 15:00 per mile, 3 mph is 20:00, 6 mph is 10:00 and 12.5 mph is 4:48. The pace per kilometer is the pace per mile divided by 1.609344, the number of kilometers in a mile [1], so 6 mph is 6:13 per kilometer.
Speed from pace
(60 × min + sec)
The pace is turned into seconds per mile and divided into the 3,600 seconds in an hour. An 8:00 mile is 3,600 ÷ 480 = 7.50 mph, and a 9:30 mile is 3,600 ÷ 570 = 6.32 mph.
Finish times
The distance in miles is multiplied by the pace per mile. A half marathon is 21.0975 km [3] and a marathon is 42.195 km [2]. At 6 mph, a 5K takes 31:04, a half marathon 2:11:06 and a marathon 4:22:11.
mph to Minutes Per Mile Chart
The chart covers walking, running and cycling speeds, rounded to the nearest second.
| Speed (mph) | Minutes per mile | Minutes per km |
|---|---|---|
| 2 | 30:00 | 18:38 |
| 2.4 | 25:00 | 15:32 |
| 2.5 | 24:00 | 14:55 |
| 2.7 | 22:13 | 13:48 |
| 2.8 | 21:26 | 13:19 |
| 3 | 20:00 | 12:26 |
| 3.5 | 17:09 | 10:39 |
| 4 | 15:00 | 9:19 |
| 4.2 | 14:17 | 8:53 |
| 4.5 | 13:20 | 8:17 |
| 5 | 12:00 | 7:27 |
| 5.5 | 10:55 | 6:47 |
| 6 | 10:00 | 6:13 |
| 6.5 | 9:14 | 5:44 |
| 7 | 8:34 | 5:20 |
| 7.5 | 8:00 | 4:58 |
| 8 | 7:30 | 4:40 |
| 8.5 | 7:04 | 4:23 |
| 9 | 6:40 | 4:09 |
| 9.5 | 6:19 | 3:55 |
| 10 | 6:00 | 3:44 |
| 11 | 5:27 | 3:23 |
| 12 | 5:00 | 3:06 |
| 12.5 | 4:48 | 2:59 |
| 13 | 4:37 | 2:52 |
| 14 | 4:17 | 2:40 |
| 15 | 4:00 | 2:29 |
| 16 | 3:45 | 2:20 |
| 18 | 3:20 | 2:04 |
| 20 | 3:00 | 1:52 |
| 22 | 2:44 | 1:42 |
| 25 | 2:24 | 1:29 |
Limits of This Estimate
- Finish times assume a constant speed with no stops. They are not a prediction of race performance.
- On a treadmill, the conversion applies to the belt speed. Incline changes the effort, not the pace.
- A 1% treadmill incline is sometimes used to match the effort of running outdoors. The study behind it found the energy cost matched at 1% for runs of about 5 minutes at 2.92 to 5.0 m/s, about 6.5 to 11.2 mph, with nine trained runners [4]. It does not guarantee the same effort at other speeds or for other runners.
Sources
- NIST Special Publication 811, Appendix B.8: kilometers and meters in one mile
- World Athletics, Marathon: marathon distance
- World Athletics, Half Marathon: half marathon distance
- Jones and Doust, A 1% Treadmill Grade Most Accurately Reflects the Energetic Cost of Outdoor Running, Journal of Sports Sciences, 1996: treadmill incline and the speeds tested