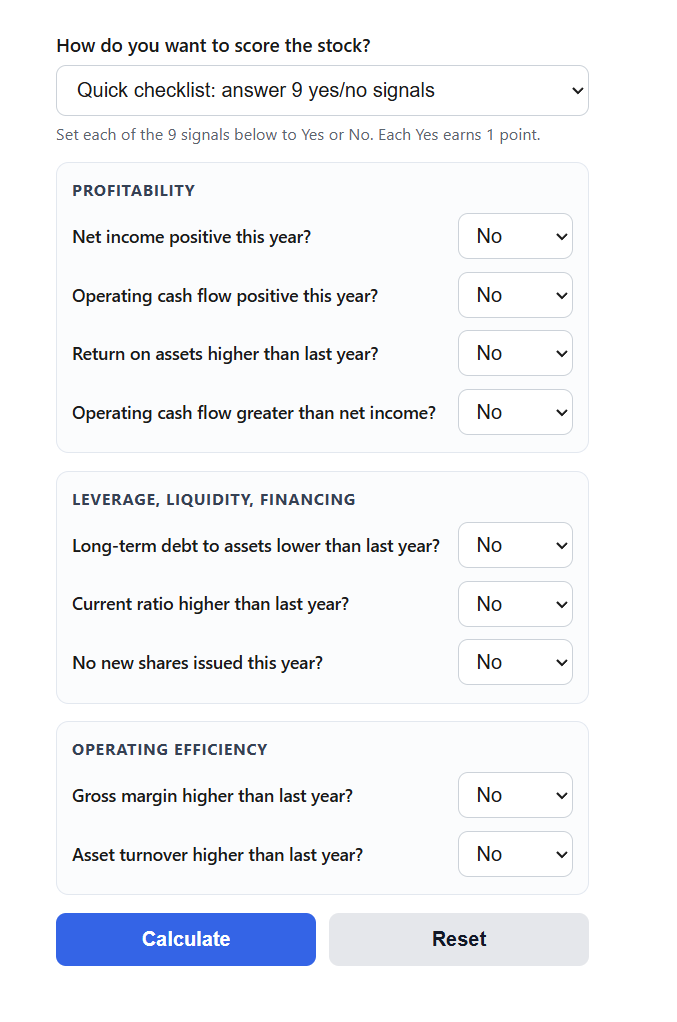
Calculate a stock’s Piotroski F-Score from 0 to 9 with a quick nine-signal checklist or automatically from two years of financial statement data.
Piotroski F-Score Formula
The Piotroski F-Score is the sum of nine binary signals. Each signal is worth 1 point if the company passes the test and 0 points if it fails:
F = ROA + CFO + dROA + ACCRUAL + dLEVER + dLIQUID + EQ + dMARGIN + dTURN
Variables:
- ROA is 1 if net income for the current year is positive
- CFO is 1 if cash flow from operations is positive
- dROA is 1 if return on assets is higher than the prior year
- ACCRUAL is 1 if operating cash flow is greater than net income
- dLEVER is 1 if long-term debt divided by total assets is lower than the prior year
- dLIQUID is 1 if the current ratio is higher than the prior year
- EQ is 1 if the company issued no new shares during the year
- dMARGIN is 1 if gross margin is higher than the prior year
- dTURN is 1 if asset turnover is higher than the prior year
The comparison signals are built from these underlying ratios:
ROA = NI / TA; CR = CA / CL; GM = GP / REV; ATO = REV / TA; LEV = LTD / TA
where NI is net income, TA is total assets, CA is current assets, CL is current liabilities, GP is gross profit, REV is revenue, and LTD is long-term debt.
The calculator works in two modes. In checklist mode you answer the nine questions with Yes or No and the tool adds up the points, which is the fastest option when you have already looked at the financial statements. In financial data mode you enter the line items from the two most recent annual reports and the calculator computes every ratio for both years, scores all nine signals, and shows the actual year over year values behind each pass or fail, along with sub-scores for profitability, leverage and liquidity, and operating efficiency.
Score Bands and How the F-Score Compares to Other Screens
The first table shows how to read the total score. Joseph Piotroski designed the score to be used inside a pool of cheap, high book-to-market stocks, so a high score identifies the fundamentally strongest names within that group.
| F-Score | Reading | Typical next step |
|---|---|---|
| 8 to 9 | Strong and improving fundamentals | Passes the classic Piotroski screen; move on to valuation |
| 6 to 7 | Solid, passes most quality tests | Check which signals failed and why |
| 4 to 5 | Mixed picture | Look for a trend by scoring two or three prior years |
| 0 to 3 | Weak or deteriorating fundamentals | Historically the highest risk group in Piotroski's research |
In Piotroski's original study, which covered high book-to-market stocks from 1976 to 1996, buying the highest scoring companies improved the value portfolio's average annual return by about 7.5 percentage points, and a strategy that bought high scorers and shorted low scorers earned roughly 23 percent annualized over the period. Those are historical research results, not a guarantee of future returns.
The second table places the F-Score next to the two other scores investors most often run on the same financial statements. Each answers a different question, so they complement rather than replace one another.
| Score | Question it answers | Range | Favorable reading |
|---|---|---|---|
| Piotroski F-Score | Is financial strength improving? | 0 to 9 | 8 or 9 |
| Altman Z-Score | How likely is bankruptcy? | Roughly -4 to +8 | Above 2.99 (safe zone) |
| Beneish M-Score | Are earnings possibly manipulated? | Roughly -5 to +5 | Below -2.22 |
A practical workflow is to screen for value first, keep only stocks with an F-Score of 7 or higher, then confirm the balance sheet with the Z-Score and the earnings quality with the M-Score before sizing a position.
Example Problems
Example 1: score a company from its financial statements. The two most recent annual reports show, in millions: net income 120 this year and 110 last year, operating cash flow 100, revenue 900 and 850, gross profit 350 and 320, total assets 1,000 and 950, long-term debt 200 and 230, current assets 400 and 360, current liabilities 200 and 190, and shares outstanding 100 both years.
Working through the signals: net income is positive (1) and operating cash flow is positive (1). ROA rises from 110 / 950 = 11.6% to 120 / 1,000 = 12.0% (1). Operating cash flow of 100 is less than net income of 120, so the accrual test fails (0). Debt to assets falls from 24.2% to 20.0% (1), the current ratio rises from 1.89 to 2.00 (1), and no new shares were issued (1). Gross margin improves from 37.6% to 38.9% (1) and asset turnover improves from 0.89 to 0.90 (1). The total is F = 8, a strong result, with the failed accrual signal flagging that earnings ran ahead of cash flow this year.
Example 2: quick checklist. You have already reviewed a 10-K and conclude the company has positive net income, positive operating cash flow, cash flow above net income, an improved current ratio, and better gross margin and asset turnover, but ROA slipped, leverage rose, and new shares were issued. That is six Yes answers, so F = 6, a solid score where the three failed signals, all trending the wrong way, tell you exactly what to investigate next.
FAQ
Where do I find the numbers the calculator asks for?
Every input comes from a company's last two annual reports or 10-K filings. Net income, revenue, and gross profit are on the income statement, operating cash flow is the first section total on the cash flow statement, and total assets, long-term debt, current assets, current liabilities, and shares outstanding are on the balance sheet. Free sources include the SEC's EDGAR database and the financials tab of most quote pages.
Is a high F-Score a buy signal?
No. The F-Score measures fundamental strength and direction, not price. A company can score 9 and still be overpriced, and Piotroski's research applied the score specifically to stocks that were already cheap on a price-to-book basis. Treat a high score as permission to keep researching, and combine it with a valuation method before buying.
Why might my score differ from a stock screener's score?
Data conventions vary. This calculator compares each year's ROA using that year's ending total assets, while some providers use beginning-of-year assets, and screeners also differ in how they detect share issuance and which debt lines count as long-term. A one-point difference between tools is common, so when scores disagree, check the signal breakdown to see which specific test flipped.