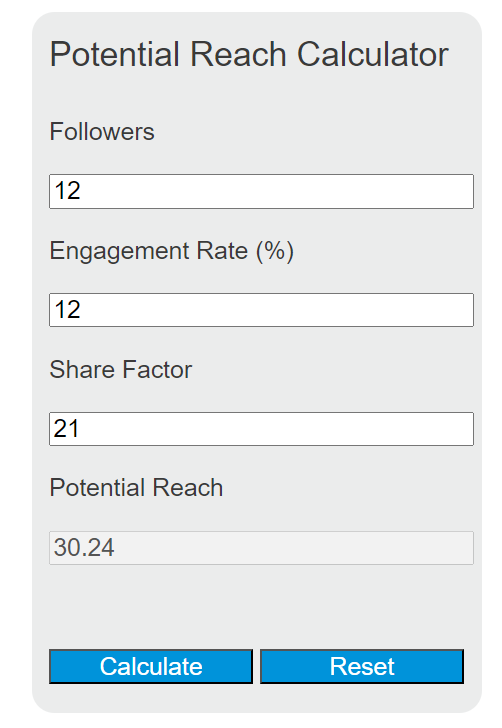
Calculate potential reach, followers, engagement rate, or share factor from the other three inputs for online social media campaigns.
Related Calculators
- Closing Ratio Calculator
- Calls Rate Calculator
- Cost Per Session Calculator
- Maximum Revenue Calculator
- All Business Calculators
Potential Reach Formula
Potential reach is a planning estimate for how many people a social media post may reach based on your follower count, expected engagement rate, and the amount of secondary exposure created through shares or amplification. It is most useful for forecasting campaign performance, comparing content ideas, and setting realistic distribution targets before publishing.
| Variable | Meaning | How to Use It |
|---|---|---|
| PR | Potential reach | The estimated number of people who may see the post. |
| F | Followers | Use your current follower count or the size of the audience segment you are targeting. |
| ER | Engagement rate | Enter this as a percentage, not a decimal. For example, enter 4.5 for 4.5%. |
| SF | Share/amplification factor | Represents how much additional exposure each engaged follower creates through sharing, tagging, reposting, or similar distribution. |
How to Calculate Potential Reach
- Determine the number of followers included in the estimate.
- Estimate the engagement rate based on recent post performance.
- Choose a share factor that reflects how much extra exposure engaged users typically generate.
- Convert the engagement rate from a percentage to a decimal by dividing by 100.
- Multiply followers by the engagement rate and then by the share factor.
This means the model first estimates how many followers engage, then scales that engagement by how much additional visibility each engaged follower creates.
Equivalent Forms
If you know three values and want to solve for the fourth, the same relationship can be rearranged as follows:
Examples
Example 1: A page has 25,000 followers, expects a 4.8% engagement rate, and estimates a share factor of 1.6.
The estimated potential reach is 1,920 people.
Example 2: A campaign target is 10,000 people reached, with an expected engagement rate of 3.2% and a share factor of 2.5. The required follower count is:
Under those assumptions, the account would need about 125,000 followers to support that projected reach.
How to Estimate the Share Factor
The share factor is usually the hardest input to estimate because it depends on how often followers repost, tag others, or otherwise extend the content beyond the original audience. A practical way to choose it is to use past campaign data and back into a reasonable average.
If you have several older posts, calculate a share factor for each one and average the results. This usually gives a better planning assumption than guessing from a single post.
- SF = 1.0: Minimal amplification; engagement does not create much extra distribution.
- SF = 1.2 to 1.8: Moderate amplification; some sharing or reposting occurs.
- SF = 2.0+: Strong amplification; engaged users frequently extend the content to others.
If you are uncertain, model three scenarios: conservative, expected, and aggressive. That gives a more useful planning range than relying on a single estimate.
Potential Reach vs. Actual Reach vs. Impressions
| Metric | What It Represents | Best Use |
|---|---|---|
| Potential Reach | A forecast based on assumptions about followers, engagement, and amplification. | Planning and benchmarking before a post goes live. |
| Actual Reach | The number of accounts or people the platform reports as having seen the post. | Performance review after publishing. |
| Impressions | Total displays of the post, including repeated views by the same person. | Measuring visibility volume rather than unique exposure. |
Because this calculator is a simplified model, the result should be treated as an estimate rather than a precise platform metric. Real distribution can be higher or lower depending on feed ranking, timing, audience overlap, creative quality, post format, and platform behavior.
Common Input Mistakes
- Entering engagement rate as a decimal instead of a percentage.
- Using total followers when only a niche segment is likely to engage.
- Applying the same share factor across every platform and content type.
- Assuming potential reach always equals unique people; overlap can reduce unique exposure.
- Ignoring seasonal or campaign-specific changes in engagement rate.
Practical Ways to Improve Potential Reach
- Increase engagement rate with stronger hooks, clearer calls to action, and better timing.
- Raise the share factor by creating content designed for reposting, tagging, and discussion.
- Segment content by audience interest so a larger share of followers is likely to engage.
- Track results by content type to find the formats that produce the strongest amplification.
- Use historical analytics to update your assumptions regularly instead of keeping static inputs.
Frequently Asked Questions
Can potential reach be greater than the follower count?
Yes. If the share factor is greater than 1, the model assumes the post reaches people beyond the original audience through secondary exposure.
Is this the same as viral reach?
No. Viral outcomes typically involve nonlinear distribution and platform recommendation effects. This calculator provides a simple estimate, not a viral prediction model.
What engagement rate should I use?
Use a recent average from comparable posts. If the content format or audience is changing, use a range rather than a single value.
Why does the result change so much with small input changes?
Because all three inputs multiply together, even a modest increase in engagement rate or share factor can materially change the final estimate.