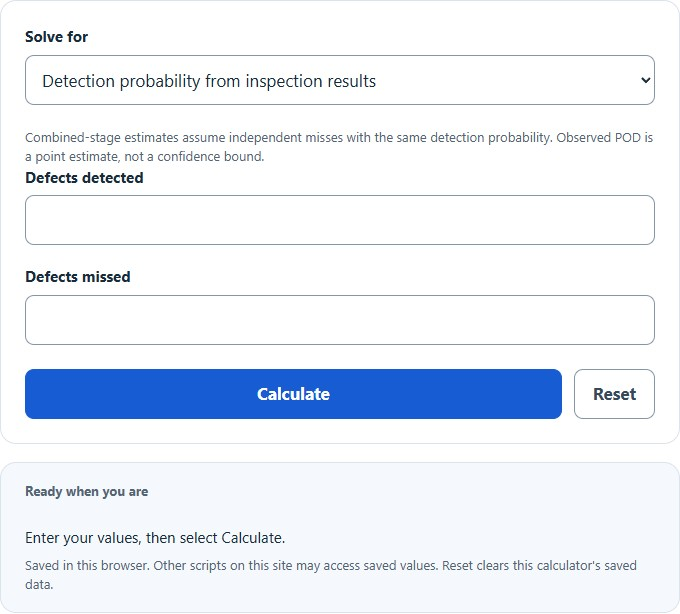
Calculate the probability of defect detection (POD) from inspection results, combined POD across inspection stages, stages needed for a target POD, and expected escaped defects.
Probability of Defect Detection Formula
- POD is the probability of defect detection (%)
- TP is the number of true positives, defects that were correctly detected
- FN is the number of false negatives, defects that were missed
- POD_total is the combined detection probability across several inspection stages (%)
- p is the per-stage detection probability as a decimal (for example 0.80 for 80%)
- n is the number of independent inspection stages
- T is the target overall detection probability as a decimal
- E is the expected number of escaped defects
- D is the number of defects actually present in the lot or batch
The first formula is the core probability of defect detection: divide the defects your inspection actually caught by all defects that were present, then multiply by 100. Only real defects enter this ratio. Good units, whether passed correctly or flagged by mistake, do not affect POD.
The second formula handles multiple inspection stages. If each stage misses a defect with probability (1 - p), the chance a defect slips past all n stages is (1 - p)^n, so the combined POD is one minus that escape probability. The third formula inverts this relationship: enter a per-stage POD and a target overall POD, and it returns the number of independent stages required, rounded up to the next whole stage. The fourth formula converts a POD into a practical planning number, the expected count of defects that will escape when D defects are present.
Inspection Evidence and Stages Needed for a Target POD
Use detection evidence for the specific inspection system, defect population and conditions. A generic method name does not establish a reliable POD. NASA explains why NDE capability must match the actual system and conditions.
The table below shows how many independent inspection stages, each with the same per-stage POD, are needed to reach a target overall detection probability. It uses n = ceil(ln(1 - T) / ln(1 - p)).
| Per-stage POD | Stages for 99% overall POD | Stages for 99.9% overall POD |
|---|---|---|
| 50% | 7 | 10 |
| 70% | 4 | 6 |
| 80% | 3 | 5 |
| 90% | 2 | 3 |
| 95% | 2 | 3 |
| 99% | 1 | 2 |
These stage counts assume the stages miss defects independently. If two stages share the same blind spot, for example the same lighting angle or the same untested failure mode, the real combined POD will be lower than the formula predicts.
Example Problems
Example 1: POD from inspection results. An audit of a production line finds that inspectors caught 45 defects while 5 defects were later discovered by customers. TP = 45 and FN = 5, so POD = 45 / (45 + 5) * 100 = 90%. The escape rate is 10%, meaning about 100 of every 1,000 defects would slip through.
Example 2: Combined POD across stages. A board passes through 3 independent inspection stages, each with an 80% detection probability. The chance a defect escapes one stage is 0.20, so the chance it escapes all three is 0.20^3 = 0.008. The combined POD is 1 - 0.008 = 0.992, or 99.2%.
Frequently Asked Questions
How is the probability of defect detection different from the defect rate? The defect rate describes how often defects occur, for example 2 defective units per 100 produced. POD describes how well your inspection finds the defects that already exist. A process can have a low defect rate and still ship faulty product if its POD is poor, and a high defect rate can be contained if the POD is high. For a single relevant defect opportunity per unit with detection probability p, the expected fraction of units escaping with that defect is the defect fraction multiplied by the miss probability (1 - p). Multiple defects per unit require a matching model.
What does a90/95 mean in nondestructive testing? In NDT, POD can be assessed as a function of flaw size for a specified inspection system and procedure. The value a90/95 is the flaw size at which the lower 95% confidence bound on POD reaches 90%. NASA-STD-5009C uses this concept for fracture-critical metallic components within its scope. Requirements depend on the applicable program and component; the simple detected/(detected + missed) ratio does not establish a90/95.
Why can't adding more inspection stages guarantee 100% detection? For a per-stage POD strictly between 0% and 100%, each independent stage multiplies the escape probability by (1 - p), so no finite number of stages reaches exactly 100% in the mathematical model. A 100% per-stage POD reaches 100% in one stage. Display rounding near 100% is not a guarantee. In practice the situation is worse than the formula suggests, because misses are often correlated: a defect type that fools one inspector or one test tends to fool the next one too. Improving the per-stage POD, or adding a stage that works on a different physical principle, usually beats stacking more copies of the same inspection.