Calculate R naught or a missing factor from contact rate, transmission probability, and infectious duration with day, hour, week, or month units.
R Naught Formula
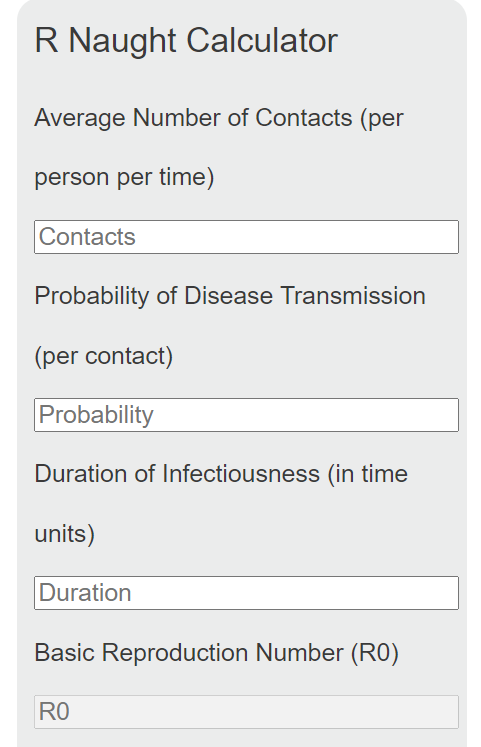
R0, pronounced R naught, is the basic reproduction number. It estimates how many secondary infections one infectious person generates on average in a population where everyone is susceptible. In this calculator, the estimate is based on contact frequency, transmission probability, and infectious duration.
Here, C is the average number of relevant contacts per person per time period, P is the probability of transmission for each contact, and D is the duration of infectiousness measured in the same time basis used for C.
Variable Meanings
| Variable | Meaning | How to Think About It |
|---|---|---|
| R0 | Basic reproduction number | The average number of new infections caused by one case in a fully susceptible population. |
| C | Average contacts per person per time | Use a consistent time unit such as per day, per week, or per month. |
| P | Transmission probability per contact | Usually entered as a decimal, such as 0.02 for 2%. |
| D | Duration of infectiousness | Must match the same time unit used for the contact rate. |
How to Calculate R Naught Correctly
- Choose the time basis for the contact rate, such as contacts per day.
- Use the same time basis for infectious duration, such as days.
- Enter the transmission probability as a decimal when appropriate.
- Multiply the contact rate, transmission probability, and infectious duration.
- Interpret the result as an average estimate, not a guaranteed outcome for every infected person.
Unit consistency matters. If C is measured per day, then D must be in days. If C is measured per week, then D must be in weeks. Mixing time units will distort the result.
Rearranged Forms of the Formula
If you know three values and want to solve for the fourth, the same relationship can be rearranged.
How to Interpret the Result
| R0 Range | Interpretation | What It Suggests |
|---|---|---|
| Less than 1 | Transmission tends to decline | Each case produces fewer than one new case on average. |
| Equal to 1 | Replacement level | Case counts tend to stay roughly steady if conditions remain unchanged. |
| Greater than 1 | Transmission can grow | Each case produces more than one new case on average, so spread can expand. |
| Well above 1 | Higher spread potential | Even modest increases in contacts, transmissibility, or infectious duration can produce much larger outbreaks. |
Example 1: Calculating R0
Suppose an infectious person has 12 relevant contacts per day, the transmission probability is 0.02 per contact, and the infectious period lasts 7 days.
An estimated R0 of 1.68 means one infectious person would generate 1.68 secondary cases on average under those assumptions.
Example 2: Solving for Contact Rate
If the target reproduction number is 0.9, the transmission probability is 0.03, and the infectious duration is 5 days, you can solve for the allowable contact rate.
That means the average contact rate would need to be 6 contacts per day to keep the simplified model at an estimated reproduction number of 0.9.
R0 vs. Effective Reproduction Number
R0 assumes a fully susceptible population. In real settings, behavior changes, immunity, vaccination, isolation, seasonality, and public health measures can all change transmission over time. That is why real-world spread is often described using an effective reproduction number rather than the basic reproduction number alone.
Simple Threshold Relationship
In a simplified homogeneous-mixing model, the fraction of the population that must be effectively immune to push sustained spread below replacement is often approximated by:
This shortcut is only meaningful when the basic reproduction number is greater than 1, and it should be treated as a theoretical estimate rather than an exact operational target.
Common Input Mistakes
- Mixing time units: using contacts per day with infectious duration in weeks.
- Using percentages instead of decimals: entering 2 instead of 0.02 for a 2% transmission probability.
- Treating R0 as a certainty: it is an average value, not an outcome for every case.
- Confusing spread with severity: a condition can have a high or low reproduction number independently of how severe the illness is.
- Assuming R0 is fixed everywhere: it depends on contact patterns, environment, and assumptions used in the model.
What This Calculator Is Best For
- Estimating the spread potential of an infectious disease under simple assumptions
- Comparing how changes in contact rate, transmission probability, or infectious duration affect overall spread
- Testing scenarios where one variable is unknown and the other three are known
- Building intuition about why reducing contacts, reducing transmission probability, or shortening infectious duration can all lower spread