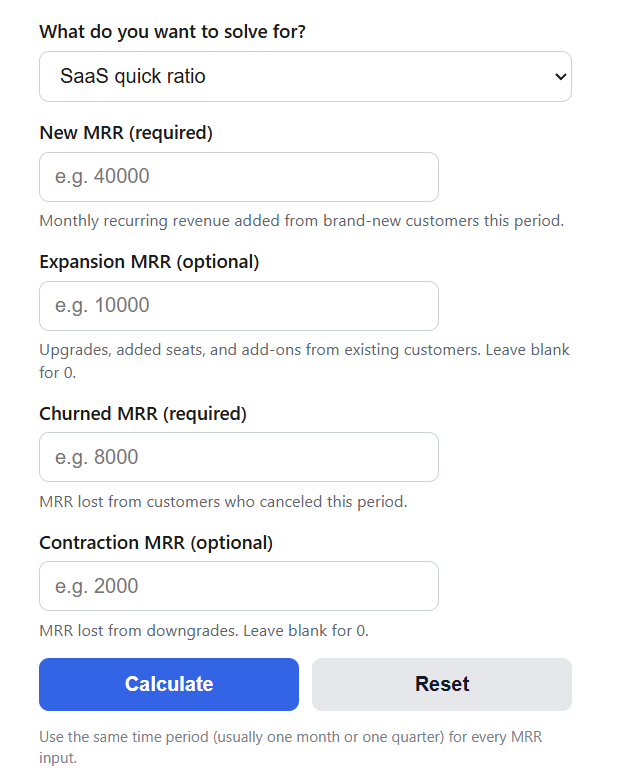
Calculate your SaaS quick ratio from new, expansion, churned, and contraction MRR to see whether recurring revenue growth is outpacing churn.
SaaS Quick Ratio Formula
SQR = (New MRR + Expansion MRR) / (Churned MRR + Contraction MRR)
- SQR is the SaaS quick ratio, a unitless multiple
- New MRR ($) is monthly recurring revenue added from brand-new customers during the period
- Expansion MRR ($) is revenue added by existing customers through upgrades, added seats, or add-ons
- Churned MRR ($) is revenue lost from customers who canceled
- Contraction MRR ($) is revenue lost from customers who downgraded
The default mode of the calculator applies this formula directly: enter the four MRR components for one period and it returns the quick ratio, your net new MRR, how many dollars you gained for every dollar lost, and the share of your gross gains you actually kept. The second mode works backward. Pick a target quick ratio, enter your expected churned, contraction, and expansion MRR, and it solves for the new MRR your sales team needs to add:
Required New MRR = Target SQR * (Churned MRR + Contraction MRR) - Expansion MRR
Every input must come from the same time period, normally one month or one quarter. Mixing a monthly churn figure with a quarterly new MRR figure will inflate the ratio by roughly a factor of three.
Benchmarks and the Share of Gains You Keep
A quick ratio is easier to act on when you convert it into the share of gross MRR gains that survive churn. That share equals 1 – 1/SQR. A ratio of 4, the standard benchmark, means you keep 75 cents of every new dollar; a ratio of 1 means churn consumes everything you add.
| Quick Ratio | Rating | Share of gains kept | What it means |
|---|---|---|---|
| Below 1.0 | Shrinking | Negative | MRR is declining even with new sales coming in |
| 1.0 | Break even | 0% | Every dollar gained is offset by a dollar lost |
| 2.0 | Leaky growth | 50% | Growing, but half of all new revenue is refilling churn |
| 4.0 | Benchmark | 75% | The widely cited target for efficient SaaS growth |
| 5.0 or more | Elite | 80% or more | Retention is strong enough that growth compounds cheaply |
Stage matters when you read the number. Young companies have a tiny churn base, so high ratios are expected; mature companies carry a large MRR base where even modest churn percentages are large dollar amounts.
| Company stage | Typical quick ratio | How to read it |
|---|---|---|
| Early stage (under $1M ARR) | 4 or higher expected | Little revenue at risk yet, so a lower ratio signals product or fit problems |
| Growth stage ($1M to $10M ARR) | 2 to 4 common | Sustained 4 or better here is a strong signal for investors |
| Scale stage (over $10M ARR) | 1.5 to 3 typical | The churn base is large, so pair the ratio with net revenue retention |
Example Problems
Example 1: solving for the quick ratio. A SaaS company adds $400,000 in new MRR and $200,000 in expansion MRR in a quarter. It loses $100,000 to churn and $50,000 to contraction. Inflows total $600,000 and outflows total $150,000, so SQR = 600,000 / 150,000 = 4.0. Net new MRR is $450,000 and the company keeps 75% of its gross gains, right at the benchmark.
Example 2: solving for required new MRR. You expect $30,000 of churned MRR and $10,000 of contraction MRR next month, plus $25,000 of expansion MRR, and you want a quick ratio of 4. Total inflow required is 4 * $40,000 = $160,000. Subtracting the $25,000 of expansion leaves $135,000 of new MRR that sales must add to hit the target.
Frequently Asked Questions
Is the SaaS quick ratio the same as the accounting quick ratio?
No. The accounting quick ratio, also called the acid-test ratio, measures short-term liquidity by comparing liquid assets to current liabilities. The SaaS quick ratio measures growth efficiency by comparing recurring revenue gained to recurring revenue lost. They share a name and nothing else, so make sure you reference the right one in board materials.
What is a good SaaS quick ratio?
The most cited benchmark is 4, meaning you add $4 of MRR for every $1 lost. Between 1 and 4 you are growing but paying a heavy churn tax, and below 1 your recurring revenue is shrinking. Treat the benchmark as stage-dependent: a seed-stage company should clear 4 comfortably, while an established company at scale can be healthy below it if net revenue retention stays strong.
Can a high quick ratio be misleading?
Yes, in two common ways. On a small revenue base the ratio swings wildly, so one canceled contract can move it by whole points and one good month can flatter it. It also says nothing about scale: $8,000 gained against $2,000 lost and $800,000 gained against $200,000 lost both score 4.0. Read the ratio next to net new MRR, and track it as a trailing three-month or quarterly average rather than a single month.