Calculate the Scheffé test F statistic for two group means or a mean difference using equal sample sizes, ANOVA k, MSE, and F-critical pass/fail.
Customize This Calculator
Build your own version. Describe what you want changed, added, or compared.
Scheffe Test Formula
The Scheffe test is a conservative post hoc method used after ANOVA to evaluate differences among group means while limiting the chance of false positives across multiple comparisons. This calculator uses ANOVA summary values to compute a Scheffe-style statistic from the mean square between groups, mean square within groups, total sample size, and number of groups.
In this formula, MSR is the mean square between groups, MSE is the mean square within groups, n is the total number of observations, and k is the number of groups. The quantity n - k is the within-groups degrees of freedom from the ANOVA model.
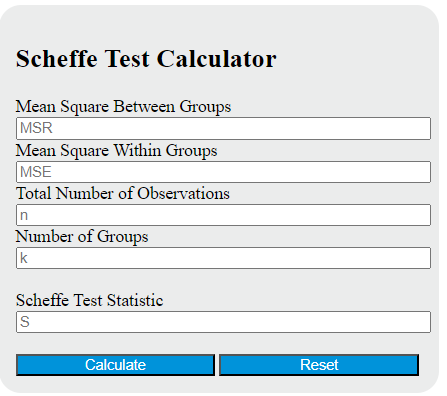
Input Definitions
| Input | Meaning | What to Enter |
|---|---|---|
| MSR | Mean square between groups from the ANOVA table | A positive value |
| MSE | Mean square within groups, often called mean square error | A positive value greater than 0 |
| n | Total number of observations across all groups | A whole number greater than k |
| k | Number of groups being compared | A whole number of at least 2 |
| S | Calculated Scheffe-style test statistic | Computed by the calculator |
How to Calculate the Scheffe Test Statistic
- Take the mean square between groups from your ANOVA output.
- Take the mean square within groups or mean square error from the same ANOVA table.
- Count the total number of observations across all groups.
- Count the number of groups included in the comparison.
- Compute the ratio of between-group variability to within-group variability.
Then multiply that ratio by the within-groups degrees of freedom.
Example
If the mean square between groups is 120, the mean square within groups is 80, the total number of observations is 50, and the number of groups is 5, then:
That means the between-group variation is 1.5 times the within-group variation, and with 45 within-group degrees of freedom the calculated statistic is 67.5.
How to Interpret the Result
In general, a larger statistic suggests that the group means are more separated relative to the variation inside the groups. A smaller statistic suggests that the apparent differences among group means are modest compared with the within-group noise.
For formal statistical decisions, Scheffe procedures are typically used in the broader context of ANOVA. That means the final conclusion often depends on the ANOVA model, the comparison being tested, and the relevant critical value. This calculator is most useful for quickly turning ANOVA summary values into a comparison statistic.
When the Scheffe Test Is Useful
- After a one-way ANOVA shows evidence that not all group means are equal.
- When you want a conservative method that controls error across many possible comparisons.
- When you may test more than simple pairwise differences, such as broader contrasts among groups.
- When protecting against false positives is more important than maximizing sensitivity.
Common Input Mistakes
- Entering the sample size for a single group instead of the total sample size.
- Using sum of squares values instead of mean square values.
- Using the number of pairwise comparisons instead of the number of groups for k.
- Entering an MSE of 0, which makes the ratio undefined.
- Using n less than or equal to k, which gives invalid within-group degrees of freedom.
Assumptions to Keep in Mind
- Observations should be independent.
- The groups should come from populations that are reasonably normal, especially for smaller samples.
- Group variances should be fairly similar when using standard ANOVA-based procedures.
- The ANOVA model should match how the data were collected and grouped.
Quick Summary of the Logic
The Scheffe approach asks whether the variation between groups is large compared with the variation within groups. If between-group variation grows while within-group variation stays small, the resulting statistic increases and the evidence for real mean differences becomes stronger.