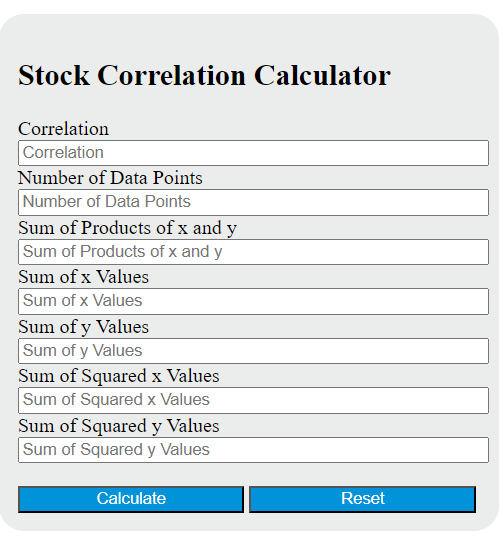
Enter all but one of the number of data points, sum of the products of the x and y values, sum of the x values, sum of the y values, sum of the squared x values, and sum of the squared y values into the calculator to determine the stock correlation coefficient.
Stock Correlation Formula
The following formula is used to calculate the stock correlation coefficient:
Correlation = (n * Σ(xy) - Σx * Σy) / sqrt((n * Σx^2 - (Σx)^2) * (n * Σy^2 - (Σy)^2))
Variables:
- Correlation is the stock correlation coefficient
- n is the number of data points
- Σ(xy) is the sum of the products of the x and y values
- Σx is the sum of the x values
- Σy is the sum of the y values
- Σx^2 is the sum of the squared x values
- Σy^2 is the sum of the squared y values
To calculate the stock correlation coefficient, multiply the x and y values for each data point and sum the products. Also, sum the x values and the y values separately. Then, calculate the squared sum of the x values and the squared sum of the y values. Finally, substitute these values into the formula to calculate the correlation coefficient.
What is a Stock Correlation?
Stock correlation is a statistical measure that indicates the relationship between the movements of two stocks in the financial market. It is expressed as a number between -1 and 1, where 1 indicates a perfect positive correlation (i.e., both stocks move in the same direction at the same time), -1 indicates a perfect negative correlation (i.e., the stocks move in opposite directions), and 0 indicates no correlation. This measure is crucial for investors and portfolio managers as it helps in diversifying a portfolio and reducing risk. For instance, by investing in stocks with a low or negative correlation, an investor can mitigate the impact of a poor performing stock, as its losses may be offset by the gains of the other less correlated or inversely correlated stock.
How to Calculate Stock Correlation?
The following steps outline how to calculate the Stock Correlation:
- First, gather the historical data for two stocks.
- Next, calculate the average return for each stock.
- Next, calculate the standard deviation for each stock.
- Next, calculate the covariance between the two stocks.
- Finally, calculate the Stock Correlation using the formula: Correlation = Covariance / (Standard Deviation of Stock 1 * Standard Deviation of Stock 2).
Example Problem:
Use the following variables as an example problem to test your knowledge.
Stock 1 average return = 0.05
Stock 1 standard deviation = 0.08
Stock 2 average return = 0.03
Stock 2 standard deviation = 0.06
Covariance between Stock 1 and Stock 2 = 0.002