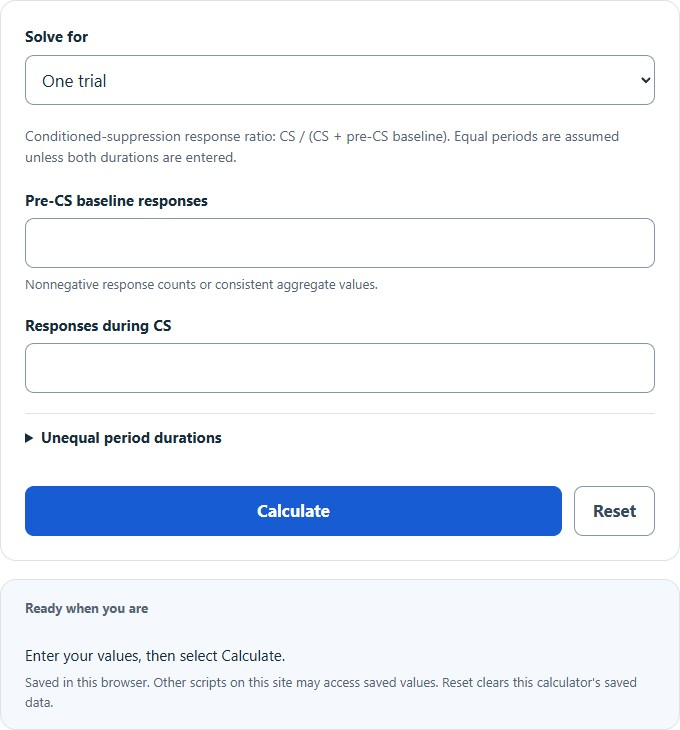
Calculate the behavioral suppression ratio from pre-CS baseline responses and responses during the conditioned stimulus (CS), with optional correction for unequal observation periods.
Suppression Ratio Formula
- SR = suppression ratio, a number from 0 to 1
- CS = number of responses made during the conditioned stimulus
- PreCS = number of responses made during the baseline period immediately before the conditioned stimulus, matched in length to the CS
This calculator uses the conventional CS / (CS + PreCS) conditioned-suppression index. With comparable observation periods and a positive baseline, 0 means no responses were observed during the CS, and 0.5 means the observed CS and baseline response rates were equal. Values below 0.5 indicate lower CS responding; values above 0.5 indicate higher CS responding. These are rate comparisons, not universal fear-severity categories or proof that conditioning is present or absent.
When the baseline period and the CS period are not the same length, the raw counts are not comparable and the ratio has to be rate corrected first:
- Dcs = duration of the CS period
- Dpre = duration of the pre-CS baseline period, in the same unit as Dcs
Enter both positive durations in the same time unit to apply duration correction; leave both blank to assume equal periods. Collapsing the durations panel does not clear or disable values already entered.
To find how many responses during the CS would produce a specific ratio, the formula is rearranged:
The multi-trial mode computes each defined trial ratio and reports their unweighted mean, sample standard deviation, descriptive standard error (sample SD divided by the square root of the number of defined trials), and first-to-last change. This is not a ratio computed from pooled counts. Each row assumes its pre-CS and CS periods were equal in length; use single-trial duration correction for unequal periods. First-to-last change alone does not establish acquisition or extinction, and repeated trials may not be independent observations.
Interpreting Suppression Ratio Values
The suppression ratio is not linear with respect to how much responding was lost. Halving the ratio from 0.4 to 0.2 is a much larger behavioral change than moving from 0.5 to 0.45. The table below converts each ratio into the equivalent response rate and percent suppression so you can see what a given value actually represents.
| Suppression ratio | CS responding as % of baseline | Percent suppression | Reading |
|---|---|---|---|
| 0.00 | 0% | 100% | No CS responses; baseline positive |
| 0.05 | 5.3% | 94.7% | CS rate is 5.3% of baseline |
| 0.10 | 11.1% | 88.9% | CS rate is 11.1% of baseline |
| 0.20 | 25.0% | 75.0% | CS rate is 25.0% of baseline |
| 0.30 | 42.9% | 57.1% | CS rate is 42.9% of baseline |
| 0.40 | 66.7% | 33.3% | CS rate is 66.7% of baseline |
| 0.50 | 100% | 0% | Equal observed response rates |
| 0.60 | 150% | -50% | Facilitation, responding increased |
Primary research describes 0.5 as equal observed response rates and 0 as complete observed suppression in the conventional index. A study using 30-second CS and 60-second baseline periods multiplies the baseline count by 0.5, matching the duration correction above. Experiments also show that freezing and suppression of reward seeking can differ; interpretation therefore requires the experimental design and other evidence.
Other Ways the Same Data Gets Reported
Papers use different indices and baseline conventions, so compare their definitions before comparing values. The formulas below use comparable periods or rates. The log-ratio row is an example with an explicit +1 pseudocount, not a universal reporting standard.
| Measure | Formula | Equal responding | Complete suppression |
|---|---|---|---|
| Suppression ratio | CS / (CS + PreCS) | 0.5 | 0 |
| Percent suppression | 100 * (PreCS – CS) / PreCS | 0% | 100% |
| Simple rate ratio | CS / PreCS | 1 | 0 |
| Difference score | PreCS – CS | 0 | equal to PreCS |
| Log ratio | log10((CS + 1) / (PreCS + 1)) | 0 | negative |
For nonnegative inputs with a positive combined total, this suppression ratio lies between 0 and 1. With positive baseline responding, zero CS responding gives 0. If baseline responding is zero but CS responding is positive, the ratio is 1; percent suppression and CS-to-baseline rate ratio remain undefined. If both inputs are zero, the suppression ratio is undefined.
Example Problems
Example 1: equal periods. A rat presses a lever 40 times during the 60-second period before the tone and 8 times during the 60-second tone. The total across both periods is 8 + 40 = 48. The suppression ratio is 8 / 48 = 0.167. Responding during the CS was 20% of baseline, so percent suppression is 80%. These numbers describe observed responding; they do not identify a training stage by themselves.
Example 2: unequal periods. The baseline was recorded over 4 minutes and produced 60 responses, while the CS lasted 1 minute and produced 9 responses. Using the raw counts would give 9 / 69 = 0.13 and would overstate suppression because the baseline period was four times longer. Rescale the baseline to the CS length first: 60 * (1 / 4) = 15 responses. The corrected ratio is 9 / (9 + 15) = 0.375, and percent suppression is (15 – 9) / 15 = 40%. The corrected calculation compares response rates rather than unequal observation times.
Frequently Asked Questions
What does a suppression ratio of 0 mean? With a positive pre-CS baseline, it means no responses were observed during the CS: complete observed suppression under this index. It does not independently quantify fear or identify why responding stopped. A ratio of 0.5 means the observed rates were equal; it is not proof that no conditioning occurred.
Why would a suppression ratio come out above 0.5? With comparable periods and a positive baseline, values above 0.5 mean responding was higher during the CS. The ratio alone does not distinguish random variation from a reproducible increase or establish its cause. A value of 1 occurs when baseline responding is zero and CS responding is positive, so baseline-dependent percentages cannot be computed in that case.
Do the pre-CS and CS periods have to be the same length? Raw-count comparison assumes equal period lengths. For unequal periods, convert both counts to rates or scale the baseline count by CS duration divided by baseline duration. Single-trial mode applies this correction when both durations are supplied; multi-trial and target modes assume equal periods. If both counts are zero, the mathematical ratio is undefined. This calculator excludes such rows from its multi-trial mean and reports the exclusion; that policy does not identify the cause of zero responding or replace a study-specific analysis convention.