Calculate trust factor or trust quotient from reliability, responsiveness, competence, intimacy, and self-orientation scores, or solve a missing value.
Trust Factor Formula (Expanded / Modified)
The following formula is used to calculate the expanded trust factor shown in the main calculator tab (it is a modified scoring model inspired by the classic Trust Equation).
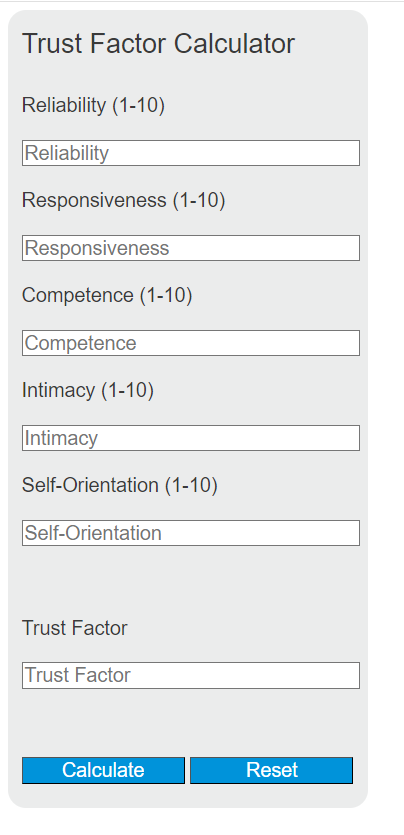
TF = (R + Re + C + I) / SO
Variables:
- TF is the trust factor
- R is the reliability score (1-10)
- Re is the responsiveness score (1-10)
- C is the competence score (1-10)
- I is the intimacy score (1-10)
- SO is the self-orientation score (1-10)
- Note: The classic Trust Equation uses Credibility (not Competence/Responsiveness) and is available in the calculator’s Classic Trust Equation tab.
To calculate the trust factor, add the scores for reliability, responsiveness, competence, and intimacy, then divide by the self-orientation score (SO must be greater than 0).
What is a Trust Factor?
A trust factor is a quantitative scoring model for assessing the perceived trustworthiness of a professional or interpersonal relationship. The concept originates from the Trust Equation, introduced by David Maister, Charles H. Green, and Robert M. Galford in their 2001 book The Trusted Advisor. The classic model expresses trustworthiness (TQ, or Trust Quotient) as: TQ = (Credibility + Reliability + Intimacy) / Self-Orientation. The expanded model on this page adds Responsiveness and substitutes Competence for Credibility, making it better suited for service delivery and support contexts where speed of response is a distinct trust driver alongside technical ability.
Both models share the same structural logic: three or four numerator variables that build trust, divided by a single denominator variable (self-orientation) that erodes it. This asymmetric design is intentional. Self-orientation sits in the denominator not because it contributes equally to other variables but because its effect is multiplicative on all of them simultaneously. A highly self-focused person can undermine all their credibility, reliability, and intimacy in a single interaction, whereas improving any single numerator has only an additive marginal effect on the final score.
The Two Models: Expanded vs. Classic Trust Equation
The Classic Trust Equation (TQ = (C + R + I) / SO) uses three numerator variables: Credibility (words and knowledge), Reliability (actions and follow-through), and Intimacy (emotional safety and connection). This is the formulation validated by Trusted Advisor Associates through their Trust Quotient Assessment, which scores each variable on a 1-20 scale across five questions each, producing a composite TQ between 20 and 100.
The Expanded Model on this calculator (TF = (R + Re + C + I) / SO) splits Credibility into Competence (domain expertise and technical accuracy) and Responsiveness (speed and quality of acknowledgment). This split matters in high-frequency interaction contexts, such as SaaS support, e-commerce, and consulting, where a client can trust your competence but lose trust because of slow response times. Research on service quality consistently finds that responsiveness is one of the top drivers of perceived service quality (alongside reliability and assurance), as established in the SERVQUAL model by Parasuraman, Zeithaml, and Berry (1988).
Component Breakdown
Reliability (R) is the degree to which a person or organization consistently delivers on stated commitments. In the Trust Equation literature, reliability is regarded as the most behaviorally observable component since it is entirely grounded in actions rather than perception. Reliability failures are the most common cause of trust erosion in client relationships: missed deadlines, inconsistent communication, and unacknowledged errors. High reliability requires not just doing what you said but calibrating promises to realistic capacity, since overpromising that leads to underdelivering is a reliability failure regardless of intent.
Responsiveness (Re) reflects how quickly and usefully a party acknowledges and addresses queries, problems, or needs. Distinct from competence (knowing the answer), responsiveness captures whether you communicate status and availability promptly. In B2B contexts, studies on client satisfaction consistently rank responsiveness among the top three predictors of perceived relationship quality. Even an acknowledgment with no resolution (“I received your message and will respond by Thursday”) meaningfully increases trust scores compared to silence.
Competence (C) addresses whether you possess the knowledge, skills, and judgment to actually solve the problem at hand. While competence is a necessary threshold for trust, research from Trusted Advisor Associates shows it is not the primary lever for increasing trustworthiness. Among professionals who have already achieved baseline credibility, further investment in credentials and technical depth produces diminishing returns on perceived trust compared to improving intimacy or reducing self-orientation.
Intimacy (I) measures the sense of psychological safety within a relationship: the degree to which the other party feels comfortable sharing sensitive information, admitting uncertainty, or being vulnerable without fear of judgment or misuse. Intimacy is the numerator variable that most distinguishes trusted advisors from mere experts. It is built through discretion (protecting shared confidences), empathy (acknowledging the human dimension of problems), and consistency of care over time. Intimacy scores tend to be the most variable across professional relationships and are strongly correlated with long-term client retention.
Self-Orientation (SO) measures the degree to which your focus is on yourself (your interests, reputation, agenda, or fee) rather than on the other party or the shared goal. This is the sole denominator variable. A self-orientation score of 1 indicates a person whose primary concern is the client or relationship; a score of 10 indicates someone primarily concerned with their own outcomes. The Trust Equation makes the structural statement that any level of self-focus proportionally discounts all trust-building behaviors simultaneously. A consultant with self-orientation 8 and otherwise excellent scores (e.g., R=9, Re=8, C=9, I=8) generates TF = 34/8 = 4.25. Reducing self-orientation to 3 with the same numerators yields TF = 34/3 = 11.3, a 166% increase in the trust score from a single variable change.
The Asymmetric Power of Self-Orientation
The denominator position of self-orientation creates a mathematical asymmetry that most practitioners underappreciate. Consider a baseline score of TF = (7+7+7+7)/5 = 5.60. A 1-point improvement in any single numerator variable (say, reliability from 7 to 8) increases the trust factor to 29/5 = 5.80, a gain of 0.20 or about 3.6%. A 1-point reduction in self-orientation (from 5 to 4) with all other variables unchanged produces TF = 28/4 = 7.00, a gain of 1.40 or 25.0%. This means that in the standard model, a single unit of improvement in self-orientation has roughly 7 times the impact of a single unit of improvement in any numerator variable. The practical implication is that professionals who want to increase their measured trustworthiness most efficiently should prioritize reducing self-focused behaviors, not acquiring additional credentials or demonstrating more competence.
Trust Factor Research Benchmarks
Trusted Advisor Associates has administered the Trust Quotient Assessment to tens of thousands of professionals. Key findings from this dataset: (1) Self-assessed trustworthiness increases with age, with improvement distributed roughly equally across all four variables (credibility, reliability, and intimacy all increase while self-orientation decreases as professionals gain experience and perspective). (2) Women are on average perceived as slightly more trustworthy than men, driven largely by higher intimacy scores. (3) Trust scores do not vary significantly by industry or job function, contradicting the common assumption that trust is primarily domain-specific. A financial advisor and a healthcare provider can achieve virtually identical Trust Quotients if their component profiles are similar, because the formula does not contain an industry coefficient.
The 2024 Edelman Trust Barometer provides a complementary organizational-level data point: ethical drivers (integrity, dependability, and purpose) account for 76% of the trust capital that businesses hold with their stakeholders, while competence accounts for only 24%. This aligns structurally with the Trust Equation’s implication that three of the four components relate to behavioral character (reliability, intimacy, self-orientation) rather than technical capability, and that overinvesting in demonstrating expertise at the expense of relational behaviors is a measurably inefficient trust-building strategy. The same 2024 report found 62% of respondents globally trust business as an institution, significantly higher than government at 51%, suggesting that entity-level trust and interpersonal trust require different assessment frameworks.
Score Interpretation by Professional Context
The five preset profiles in the calculator reflect documented patterns across professional contexts. Healthcare providers (R=8, Re=7, C=9, I=8, SO=2) typically achieve the highest trust factors because patient safety culture drives extremely low self-orientation and clinical competence requirements enforce high competence scores; the resulting TF of 16.0 in the expanded model reflects a relationship where the professional’s primary orientation is the patient’s outcome. Financial advisors (R=8, Re=6, C=9, I=6, SO=3) score lower intimacy because regulatory constraints limit the depth of personal disclosure appropriate in advisory relationships, and responsiveness is constrained by market hours and compliance review. E-commerce retailers (R=7, Re=8, C=7, I=5, SO=4) show the highest self-orientation and lowest intimacy of the five presets, reflecting that consumer relationships are inherently more transactional; the expanded TF of 6.75 is still functional because high responsiveness (fast shipping notifications, easy returns) compensates somewhat. SaaS/Software support (R=7, Re=9, C=8, I=6, SO=3) features the highest responsiveness score of any preset, validating what customer success research shows: in technical support contexts, response speed is a primary trust signal because it signals resource commitment and problem prioritization by the vendor.
A useful practical threshold: trust factors below 4.0 (on the 1-10 scale used here) typically indicate a relationship under stress where one or more variables requires active remediation. Factors between 4.0 and 8.0 represent functional working relationships. Factors above 8.0 indicate a high-trust relationship where the counterparty is likely to act as an advocate, tolerate occasional failures, and share sensitive information proactively. On the Classic Trust Equation scale (1-100 via the TQ Assessment), the average professional scores in the low-to-mid range, with the top quartile clustering around scores that reflect low self-orientation scores more than exceptionally high numerator scores.