Calculate Welch’s t score from two means, standard deviations, and sample sizes to compare the difference between two groups statistically.
Related Calculators
- Z-Score Calculator
- Kruskal Wallis Effect Size Calculator
- Crossover Sample Size Calculator
- Cochran’s Sample Size Calculator
- All Statistics Calculators
Welch’s T Test Formula
Welch’s t-test compares the means of two independent groups when the groups may have different variances and different sample sizes. In practice, it is often the safest version of the two-sample t-test because it does not rely on the equal-variance assumption.
The denominator is the standard error of the difference between the two sample means.
To turn the t-score into a p-value, you also need Welch’s approximate degrees of freedom.
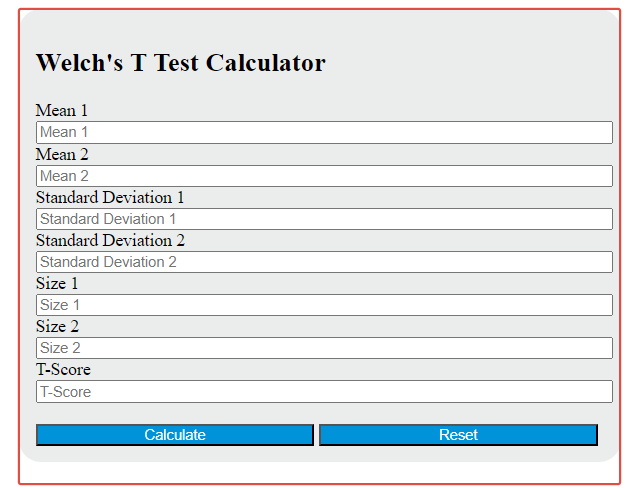
What each calculator field means
| Calculator Field | Description |
|---|---|
| Mean 1 | The sample average for the first group. |
| Mean 2 | The sample average for the second group. |
| Standard Deviation 1 | The sample standard deviation for the first group. |
| Standard Deviation 2 | The sample standard deviation for the second group. |
| Size 1 | The number of observations in the first sample. |
| Size 2 | The number of observations in the second sample. |
| T-Score | The standardized difference between the two sample means. |
When to Use Welch’s T Test
Use Welch’s t-test when you want to compare the average values of two independent groups and you do not want to assume that both groups have the same variance. This is especially useful when:
- The sample sizes are different.
- The standard deviations are noticeably different.
- The data are numeric and roughly continuous.
- You are comparing two separate groups, not matched pairs.
Welch’s t-test is not the right choice for paired data, repeated measurements on the same subjects, or outcomes that are categorical rather than numeric.
Welch’s T Test vs Other T-Tests
| Test | Best Used For | Main Assumption |
|---|---|---|
| Welch’s t-test | Two independent groups with unequal variances or unequal sample sizes | Does not require equal variances |
| Pooled two-sample t-test | Two independent groups with similar variability | Assumes equal variances |
| Paired t-test | Before-and-after data or matched observations | Uses within-pair differences, not independent samples |
How to Interpret the T-Score
The usual null hypothesis is that the two population means are equal.
- Positive t-score: Group 1 has a higher sample mean than Group 2.
- Negative t-score: Group 1 has a lower sample mean than Group 2.
- Larger absolute t-score: Stronger evidence that the population means differ.
- Statistical significance: Determined by combining the t-score with the degrees of freedom and your chosen significance level.
A statistically significant result tells you the difference is unlikely to be explained by sampling noise alone, but it does not automatically mean the difference is large or practically important.
How to Calculate Welch’s T Test
- Find the sample mean for each group.
- Find the sample standard deviation for each group.
- Record the sample size for each group.
- Compute the standard error of the difference in means.
- Divide the difference in means by that standard error to obtain the t-score.
- Use the approximate degrees of freedom to evaluate significance or calculate a p-value.
Confidence Interval for the Mean Difference
The same standard error can be used to build a confidence interval for the difference between the two population means.
If the confidence interval does not include zero, that supports the conclusion that the two means differ at the corresponding confidence level.
Example
Suppose Group 1 has a mean of 10 and a standard deviation of 2 from 20 observations, while Group 2 has a mean of 8 and a standard deviation of 3 from 25 observations.
This means the observed difference between the sample means is about 2.67 standard errors away from zero. The next step is to compare that result against the t-distribution with the calculated degrees of freedom to determine whether the difference is statistically significant.
Assumptions and Common Mistakes
- The two samples should be independent of each other.
- Observations within each sample should also be independent.
- The data should be roughly normal when sample sizes are small.
- Extreme outliers can distort the mean and standard deviation.
- Do not enter standard error in place of standard deviation.
- Do not use Welch’s t-test for paired or repeated-measures data.
If your sample sizes are reasonably large, Welch’s t-test is generally robust and is often preferred over the equal-variance two-sample t-test when there is any doubt about the spreads of the two groups.