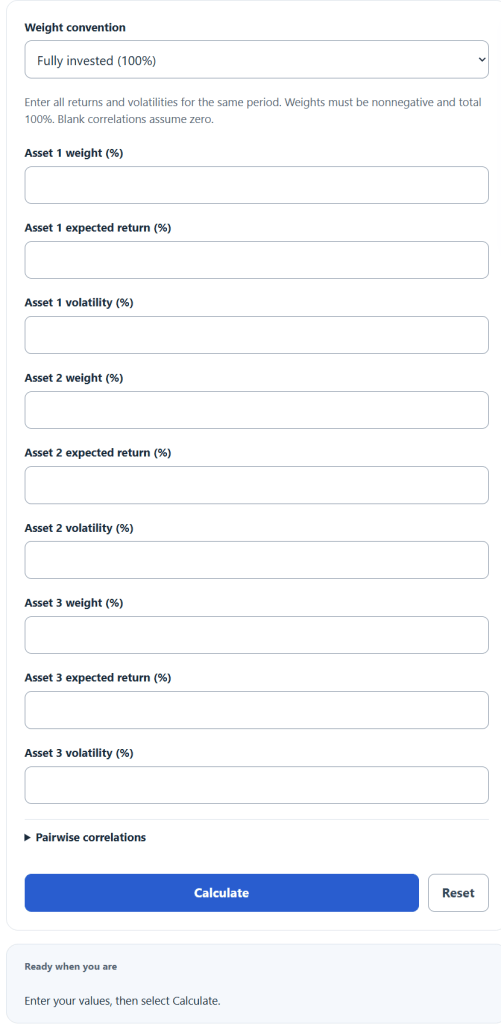
Calculate the expected return and risk (volatility) of a three-asset portfolio using each asset’s weight, return, volatility, and correlations.
3-Asset Portfolio Formula
The expected return of a three-asset portfolio is the weighted average of the three asset returns:
E(R_p) = w_1 R_1 + w_2 R_2 + w_3 R_3
The portfolio variance accounts for how the assets move together through their correlations:
Var_p = w_1^2 s_1^2 + w_2^2 s_2^2 + w_3^2 s_3^2 + 2 w_1 w_2 p_12 s_1 s_2 + 2 w_1 w_3 p_13 s_1 s_3 + 2 w_2 w_3 p_23 s_2 s_3
The portfolio volatility (standard deviation) is the square root of the variance:
Volatility_p = sqrt(Var_p)
Where:
E(R_p) is the expected return of the portfolio. w_1, w_2, and w_3 are the weights (fractions) of each asset, which must sum to 1 (100%) in the fully invested mode. Custom exposures may be signed and are not normalized. R_1, R_2, and R_3 are the expected returns of each asset. s_1, s_2, and s_3 are the volatilities (standard deviations) of each asset. p_12, p_13, and p_23 are the correlation coefficients between each pair of assets, each ranging from -1 to 1. Var_p is the portfolio variance and Volatility_p is the portfolio standard deviation, the most common measure of total portfolio risk.
Each weight scales how much an asset contributes to return and risk. For nonnegative portfolio weights, correlations below 1 can reduce volatility below the weighted average of individual volatilities. All three correlations must form a valid correlation matrix.
Correlation and Diversification Reference
The correlation you enter between each pair of assets has a large effect on total risk. The table illustrates two-asset relationships with positive weights; the complete three-asset result also depends on the other correlations and weights.
| Correlation | Relationship | Effect on Portfolio Risk |
|---|---|---|
| +1.0 | Move together exactly | No diversification; risk equals the weighted average |
| +0.5 | Move together loosely | Some risk reduction |
| 0.0 | Unrelated | Meaningful risk reduction |
| -0.5 | Tend to offset | Strong risk reduction |
| -1.0 | Move opposite exactly | Maximum diversification; risk can fall sharply |
The following ranges are illustrative assumptions only, not current estimates or recommendations. Use return, volatility, and correlation estimates for the same period and your specific assets.
| Asset Class | Illustrative Expected Return | Illustrative Volatility |
|---|---|---|
| Stocks | 7% to 10% | 15% to 20% |
| Bonds | 2% to 5% | 4% to 8% |
| Cash / Money Market | 1% to 4% | 0% to 2% |
Example
Suppose you hold three assets with the following inputs. Asset 1: weight 40%, expected return 8%, volatility 15%. Asset 2: weight 35%, expected return 5%, volatility 10%. Asset 3: weight 25%, expected return 3%, volatility 6%. The correlations are 0.20 between assets 1 and 2, 0.10 between assets 1 and 3, and 0.30 between assets 2 and 3.
The expected return is (0.40)(8) + (0.35)(5) + (0.25)(3) = 5.70%. The portfolio variance works out to 63.85, so the portfolio volatility is the square root of that, about 7.99%. Notice this is well below the simple weighted average volatility of 11.0%, which is the diversification benefit from holding assets that are not perfectly correlated.
FAQ
Why is my portfolio volatility lower than the average of the individual volatilities?
For nonnegative weights, imperfect correlation can reduce combined volatility below the weighted average. The amount depends on all weights, volatilities, and correlations; it does not eliminate the risk of loss.
Do the weights have to add up to 100%?
For the fully invested mode, yes: nonnegative weights must total 100%. Choose custom exposures for intentional leverage, short positions, or a different total. That mode does not normalize weights or include omitted cash, financing, fees, or taxes.
What correlation values should I use?
Blank correlations assume zero linear correlation; this is an assumption, not a claim about the assets. Use comparable historical observations or justified estimates for the same period. Each pair must lie between -1 and 1, and impossible joint combinations are rejected.