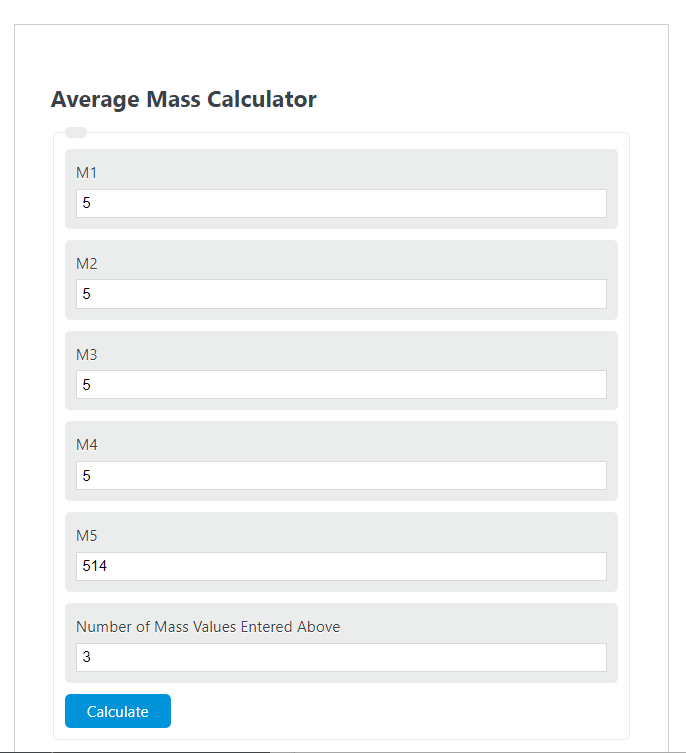
Calculate the average mass from multiple values or find the missing mass needed to reach a target average in kg, g, mg, lb, or oz.
- All Statistics Calculators
- All Mass Calculators
- Average Atomic Mass Calculator
- N to Mass Calculator
- Mass Flux Calculator
Average Mass Formula
The average mass of a set of objects is the arithmetic mean of their individual masses: sum all masses and divide by the total count.
- AM = average mass (any consistent unit: kg, g, lb, oz)
- M1 through Mn = individual object masses
- n = total number of objects in the set
What Average Mass Represents
Average mass is the central tendency of a mass distribution. It is the single value that best represents a collection of objects when every item contributes equally to the result. It differs from weighted average mass, where each object's contribution is scaled by a factor such as volume fraction, natural abundance, or frequency of occurrence. When all objects in a set are discrete and equivalent units, the simple arithmetic mean applies. In chemistry, the periodic table lists average atomic mass values calculated as weighted means across isotopes, using each isotope's natural abundance as its weight. This is why chlorine has a tabulated atomic mass of 35.45 amu rather than a whole number (35 for chlorine-35 or 37 for chlorine-37).
Average mass is meaningful in statistical mechanics because the bulk thermal energy, pressure, and diffusion rate of a gas depend on the average kinetic energy of its molecules, which scales directly with average molecular mass. In a mixed gas, substituting a weighted average molar mass into the ideal gas law gives accurate predictions for the mixture without tracking each species separately.
Reference Mass Data by Category
Benchmarks for average mass across common physical systems and biological populations.
| Object or System | Average Mass | Notes |
|---|---|---|
| Global adult human | 62 kg | BMC Public Health 2012 study, population-weighted |
| U.S. adult male | 90.6 kg | CDC National Health Statistics Reports |
| U.S. adult female | 77.5 kg | CDC National Health Statistics Reports |
| Newborn infant (global) | 3.4 kg | WHO global reference standard |
| Domestic cat | 4.5 kg | Veterinary range 3.6 to 5.4 kg |
| Basketball (NBA regulation) | 0.623 kg | Official weight specification |
| Soccer ball (FIFA) | 0.43 kg | 410 to 450 g at kickoff per Laws of the Game |
| CubeSat (1U standard) | 1.33 kg | Maximum per NASA CubeSat design specification |
| Compact passenger car | 1,350 kg | EPA vehicle segment average, curb weight |
| Full-size pickup truck | 2,200 kg | Major U.S. models, curb weight |
| Water molecule (H2O) | 18.015 amu | Calculated from atomic masses on periodic table |
Where Average Mass Matters
Logistics and Freight Planning
Carriers calculate payload capacity, fuel requirements, and axle load compliance using average cargo mass. A distribution center averaging 500 packages per truckload does not weigh every individual parcel at route-planning time; the average package mass multiplied by count gives a reliable gross weight estimate within a few percent. The Federal Motor Carrier Safety Administration sets bridge formula weight limits based on gross vehicle weight, and shippers use average unit mass to model how close a loaded vehicle will come to those legal limits before tendering freight.
Pharmaceutical and Food Manufacturing
Production batches of tablets, capsules, and food portions are sampled continuously, and the average mass of each sample is compared against the target specification. A tablet press producing 500 mg capsules must hold average deviation within 2 percent (10 mg) to comply with USP General Chapter tolerances for uniformity of dosage units. Statistical process control charts track average mass on X-bar charts alongside range or standard deviation on R-charts and S-charts to detect process drift before out-of-spec units leave the line. In food manufacturing, average net weight compliance is enforced by the Fair Packaging and Labeling Act, which permits small individual underweights only if the mean of a sampled lot meets the declared weight.
Aerospace and Structural Engineering
Mass budgets for spacecraft allocate total launch mass across subsystems and use average mass estimates for components not yet manufactured. CubeSat developers plan structural loads using the average mass of internal printed circuit boards, typically 30 to 80 g per board, multiplied by board count. Accuracy matters because engineers specify center of gravity tolerances as tight as 0.05 mm for spin-stabilized satellites; an average mass error of even a few grams can shift the center of gravity outside tolerance. Civil structures such as bridges use average material mass per unit area combined with live load estimates derived from average occupant mass to calculate deflection and stress under design loads per ASCE 7 standards.
Ecology and Population Biology
Average body mass is one of the most predictive single variables in ecology. Kleiber's Law, established in 1932 and validated across five decades of data, states that an animal's basal metabolic rate scales to the 3/4 power of its body mass. This means average mass alone predicts energy demand with reasonable accuracy across organisms ranging from a 20 g mouse to a 4,000 kg elephant. Wildlife biologists monitor shifts in average body mass within herds, fish schools, or insect colonies as early indicators of nutritional stress, disease pressure, or climate-driven habitat change. A persistent downward trend in average mass within a monitored population often precedes measurable declines in reproduction rates by one to two seasons.
Simple Average vs. Weighted Average Mass
The calculator above computes a simple arithmetic average: every object is treated as equally representative, regardless of any other property. This is appropriate when each object is a discrete, equivalent unit, such as a batch of machined parts, a set of rock samples, or a group of animals of the same species and age class.
Weighted average mass is required when objects are not equally representative. Consider a mineral deposit composed of 80% quartz (density 2.65 g/cm3) and 20% feldspar (density 2.56 g/cm3). The simple average density would be (2.65 + 2.56) / 2 = 2.605 g/cm3, but the correct value accounting for volume fractions is (0.80 x 2.65) + (0.20 x 2.56) = 2.632 g/cm3. The same weighted approach applies to isotopic masses in chemistry, alloy component masses in metallurgy, species biomass in ecosystem accounting, and any scenario where each contributing element represents a different proportion of the whole.
A practical distinction: use simple average mass when counting discrete objects of the same type; use weighted average mass when combining categories, mixtures, or populations with different proportional contributions to the total.