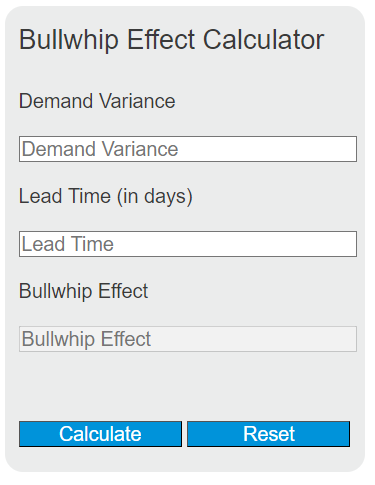
Calculate the bullwhip effect ratio from demand and order variance, standard deviations, or CVs to measure supply chain amplification.
Customize This Calculator
Build your own version. Describe what you want changed, added, or compared.
Related Calculators
- Warehouse Capacity Calculator
- Inventory Months On Hand Calculator
- Leontief Production Equation Calculator
- Implied Utilization Calculator
- All Business Calculators
Bullwhip Effect Formula
The bullwhip effect is commonly quantified as an amplification ratio comparing how variable orders are relative to customer demand.
Variables:
- Var(Q) is the variance of orders placed upstream
- Var(D) is the variance of customer demand
- σQ is the standard deviation of orders
- σD is the standard deviation of demand
To quantify the bullwhip effect, divide the variance of orders by the variance of demand (a dimensionless ratio). A value greater than 1 indicates that orders are more variable than demand (amplification).
What is the Bullwhip Effect?
The bullwhip effect is a supply chain phenomenon where small changes in consumer demand at the retail end can result in larger and amplified fluctuations in orders placed on suppliers and manufacturers. This effect can lead to inefficiencies in the supply chain, such as excessive inventory, poor customer service, lost revenues, and misguided capacity plans. Understanding and mitigating the bullwhip effect is crucial for supply chain optimization.
How to Calculate the Bullwhip Effect?
The following steps outline how to calculate the Bullwhip Effect:
- Determine the demand variance, Var(D), over a consistent time period (e.g., daily or weekly).
- Determine the order variance, Var(Q), over the same time period.
- Use the formula Bullwhip Ratio = Var(Q) / Var(D).
- Interpret the result: values greater than 1 indicate amplification (bullwhip).
- After inserting the variables and calculating the result, check your answer with the calculator above.
Example Problem:
Use the following variables as an example problem to test your knowledge.
Demand Variance (Var(D)) = 100
Order Variance (Var(Q)) = 225