Enter the total number of catches and the total effort units into the Calculator. The calculator will evaluate the Catch Per Unit Effort. 

Catch Per Unit Effort Calculator

Enter any 2 values to calculate the missing variable


Related Calculators

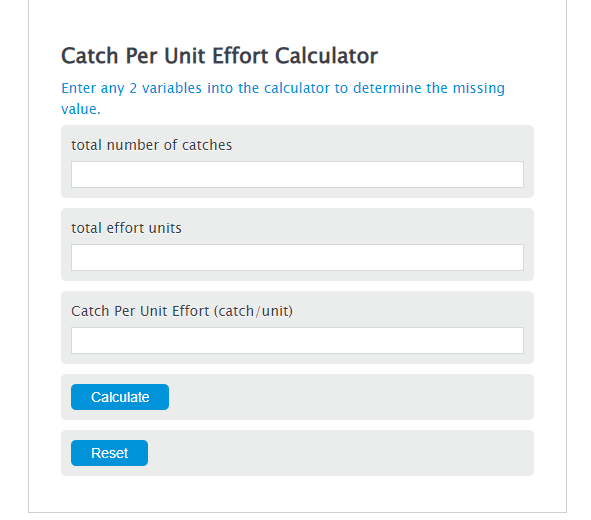
Catch Per Unit Effort Formula

CPUE = C / E

Variables:

  • CPUE is the Catch Per Unit Effort (catch/unit)
  • C is the total number of catches
  • E is the total effort units

To calculate Catch Per Unit Effort, divide the number of catches by the number of effort units.

What CPUE Actually Measures

CPUE is not a direct count of fish. It is a relative abundance index built on the assumption that catch rate is proportional to true stock density. The underlying relationship is CPUE = q x N, where q is the catchability coefficient (the fraction of the stock captured per unit effort) and N is true population abundance. When q stays constant over time, declining CPUE signals a declining stock. The challenge is that q rarely stays constant, which is why raw CPUE must often be standardized before use in formal stock assessments.

Because CPUE reflects relative change rather than absolute numbers, fisheries scientists treat it as an index that must be calibrated. A CPUE of 50 kg per vessel-day in 1990 compared to 20 kg per vessel-day in 2025 says something meaningful about the stock trajectory, but it cannot directly answer how many fish remain in the water.

Effort Units Across Fishery Types

The denominator of the CPUE formula is effort, and effort is defined differently depending on the gear and target species. Using an inappropriate effort unit inflates or masks real abundance trends.

Longline fisheries express effort in hook-hours (number of hooks multiplied by soak time) or as hooks-per-set. Atlantic bluefin tuna assessments commonly report CPUE as catch per 1,000 hooks set. Trawl fisheries use trawl-hours or swept area, with swept area (net mouth width multiplied by distance towed) being preferred because it accounts for the actual volume of water screened. Gillnet fisheries standardize by net-soak-hours or net-km, since both the length of net deployed and time in the water drive catchability. Trap and pot fisheries report CPUE as catch per trap-lift, and crustacean stock surveys often use catch per 100 traps. At the fleet scale, vessel-days of fishing normalizes catch across different fleet sizes and is the unit most commonly used in international fisheries agreements and quota negotiations.

Gear characteristics that must be standardized alongside the effort unit include mesh size, hook size and type, bait type, soak time, set depth, and orientation relative to current. Ignoring these factors introduces systematic bias: a switch from J-hooks to circle hooks in a tuna longline fishery can change catchability by 20 to 50 percent, distorting any CPUE trend that spans the transition.

The Catchability Coefficient and Its Instability

The catchability coefficient (q) represents the fraction of a fish stock captured per unit of effort. In theory, if effort doubles and the stock is unchanged, catch doubles. In practice, q shifts over time due to improvements in vessel sonar and GPS technology that allow captains to target fish more precisely, changes in gear design, shifts in fish spatial distribution driven by environmental conditions, and changes in fish behavior across life stages.

This instability is why CPUE standardization is a core step in modern stock assessment. Statistical models, typically generalized linear models (GLMs) or generalized additive models (GAMs), are applied to CPUE data to remove the influence of confounding factors such as year, season, fishing area, vessel size, and gear configuration. The residual year effect, after controlling for everything else, is the component of CPUE variation most likely attributable to actual changes in stock abundance. This standardized index is what gets incorporated into formal stock assessment models like surplus production models and statistical catch-at-age models.

Hyperstability and Hyperdepletion

The relationship between CPUE and abundance is often non-linear. Fisheries ecologists model this using CPUE = q x Nb, where b describes how CPUE responds to changes in abundance. When b equals 1, CPUE tracks abundance proportionally. When b is less than 1, the fishery is hyperstable: CPUE remains elevated even as the stock declines, masking depletion from managers. When b exceeds 1, hyperdepletion occurs: CPUE falls faster than true abundance, which can trigger precautionary closures even when the stock is less severely reduced than catch rates suggest.

Hyperstability is common in schooling species and FAD-associated fisheries. Purse seine fleets targeting yellowfin and skipjack tuna around fish aggregating devices (FADs) are a well-documented example: fish aggregate densely at FADs even when the broader population is declining, so catch rates per set remain high until the stock is severely reduced. Hyperdepletion tends to appear in sedentary or territorial species, or in fisheries where targeted depletion of accessible aggregations leaves a less-catchable residual population. The Loligo gahi squid fishery around the Falkland Islands shows both phenomena depending on abundance level: hyperdepleted at high and intermediate abundance, hyperstable at low abundance. Steelhead fisheries in British Columbia have been documented as hyperstable across 14 river systems, meaning catch rate data has masked the true magnitude of population decline.

CPUE as a Management Signal: What the Global Data Shows

Across global commercial marine fisheries, effective CPUE has declined by more than 80% in most fishing nations between 1950 and 2015, even as fishing technology improved dramatically. The apparent stabilization in global catch volumes during the same period was sustained largely by expanding into new fishing grounds and targeting previously unexploited species, not by recovering CPUE in established fisheries. This divergence between catch volume and CPUE is one of the clearest signals of serial depletion in the historical record.

FAO’s 2025 assessment of global marine stocks classified 35.5% of assessed stocks as overfished, compared to roughly 10% in the late 1970s. The share of stocks classified as biologically sustainable fell from approximately 90% in 1974 to 62% today. CPUE time series contributed to the identification of many of these overfished stocks, as declining catch rates were often the earliest available warning signal in fisheries lacking independent scientific surveys. In regions where active fisheries management has been implemented, such as the North Atlantic and US West Coast, CPUE has stabilized or recovered in several stocks, providing evidence that well-enforced harvest controls can reverse depletion trends.

Depletion Methods: Estimating Absolute Abundance from CPUE

One underutilized application of CPUE is the Leslie depletion method, which uses a sequential catch-and-effort series from a closed population to estimate absolute abundance without independent surveys. The method rests on the observation that in a closed population being fished down, CPUE declines linearly as a function of cumulative catch (assuming constant q). Plotting CPUE against cumulative catch and extrapolating the regression line to the x-intercept (where CPUE would reach zero) gives an estimate of the initial population size. Dividing CPUE by the slope of that regression yields the catchability coefficient q.

The Leslie method requires that the population is closed to immigration and emigration during the study period, that q is constant across the depletion experiment, and that natural mortality is negligible relative to fishing mortality. These requirements make it most suitable for short-duration experiments on isolated or enclosed populations, such as lake fisheries, enclosed bays, or reef sections. For open-ocean stocks, the method provides useful short-term estimates but should be cross-validated against other assessment approaches.

FAQs

What does a declining CPUE actually mean for a fishery?

A sustained multi-year decline in CPUE is one of the primary early-warning indicators that a fish stock is being harvested faster than it can reproduce. A single year of low CPUE can also reflect environmental factors like unusual water temperatures, prey availability shifts, or seasonal changes in fish distribution. Managers typically require at least 3 to 5 years of declining trend before attributing CPUE changes to stock depletion, and cross-reference catch rates with independent scientific surveys whenever available.

Why do some fisheries maintain high CPUE even when stocks are clearly declining?

This is hyperstability, and it is most common in schooling species like tuna, sardines, and anchovy. When fish aggregate tightly around predictable features such as floating debris, thermal fronts, or upwelling zones, skilled captains can maintain high catch rates even as the broader population shrinks. The danger is that high CPUE signals apparent stock health until the aggregations collapse, at which point the underlying stock may already be severely depleted. Catch history from the North Atlantic cod fishery in the late 1980s is often cited as a cautionary example of hyperstability masking catastrophic decline.

How is CPUE standardized for stock assessment?

Raw CPUE is analyzed using generalized linear models (GLMs) or generalized additive models (GAMs) that partition variation into components attributable to year (reflecting abundance changes), season, fishing area, vessel characteristics, gear configuration, and captain experience. The year effect isolated by the model is used as the standardized abundance index. This process removes bias from changes in fleet behavior and technology that would otherwise distort the trend. The choice of model structure, including which factors to include and how to handle interactions, can substantially affect the resulting index and downstream stock assessment conclusions.

Can CPUE be converted into an estimate of actual fish population size?

Alone, CPUE is only a relative index. Conversion to absolute abundance requires an estimate of the catchability coefficient q. Methods for estimating q include depletion experiments (Leslie method), mark-recapture studies, hydroacoustic surveys, and calibration against fishery-independent trawl surveys. Once q is known, the relationship N = CPUE / q provides an abundance estimate, though q estimates carry substantial uncertainty and are a major source of error in stock assessments. For this reason, CPUE is most reliably used to track relative trends over time rather than to generate absolute population estimates.