Calculate upper and lower control limits from the mean, standard deviation, and control limit factor for statistical process control.
Control Limit Formula
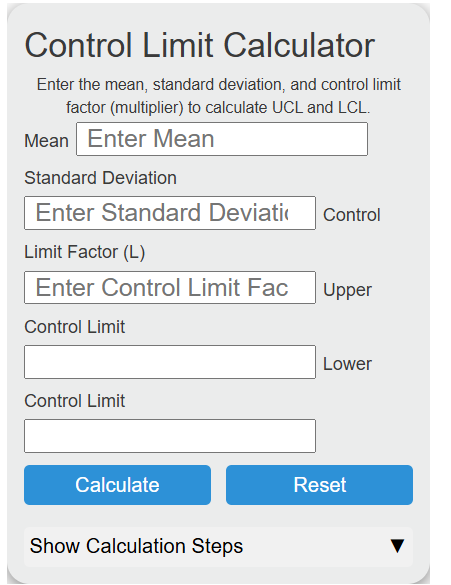
The control limit calculator uses the process mean, standard deviation, and a control limit factor to calculate the upper and lower control limits.
- UCL = upper control limit
- LCL = lower control limit
- x̄ = mean or process average
- s = standard deviation
- L = control limit factor, commonly 3 for three-sigma limits
The calculator adds L × standard deviation to the mean to find the upper control limit. It subtracts L × standard deviation from the mean to find the lower control limit. The factor controls how wide the limits are. A larger factor creates wider limits, while a smaller factor creates tighter limits.
Common Control Limit Factors
The control limit factor is often chosen based on how sensitive you want the chart to be to process variation.
| Control Limit Factor | Common Name | Typical Use |
|---|---|---|
| 1 | 1-sigma limits | Very tight limits, usually too sensitive for process control |
| 2 | 2-sigma limits | Moderately sensitive limits |
| 3 | 3-sigma limits | Standard choice for many control charts |
Interpreting Control Limit Results
| Result Pattern | Basic Interpretation |
|---|---|
| Data point is between LCL and UCL | The point is within expected process variation. |
| Data point is above UCL | The point may indicate a special cause or unusual high value. |
| Data point is below LCL | The point may indicate a special cause or unusual low value. |
Control Limit Examples
Example 1: Three-sigma control limits
Suppose the mean is 50, the standard deviation is 4, and the control limit factor is 3.
UCL = 50 + (3 × 4) = 62
LCL = 50 – (3 × 4) = 38
The upper control limit is 62 and the lower control limit is 38.
Example 2: Two-sigma control limits
Suppose the mean is 120, the standard deviation is 6.5, and the control limit factor is 2.
UCL = 120 + (2 × 6.5) = 133
LCL = 120 – (2 × 6.5) = 107
The upper control limit is 133 and the lower control limit is 107.
FAQ
What is a control limit?
A control limit is a boundary used on a control chart to judge whether a process is behaving within expected variation. The upper control limit is the high boundary, and the lower control limit is the low boundary.
What control limit factor should you use?
A factor of 3 is commonly used because it creates three-sigma control limits. These limits are wide enough to avoid flagging too many normal variations while still identifying unusual process behavior. A different factor may be used if your process or quality method requires tighter or wider limits.
Can the lower control limit be negative?
Yes, the formula can produce a negative lower control limit if the mean is small compared with the standard deviation. Whether that value makes sense depends on the measurement. For counts, weights, times, and other values that cannot be negative, you may need to interpret a negative LCL as zero or use a chart method suited to the data type.