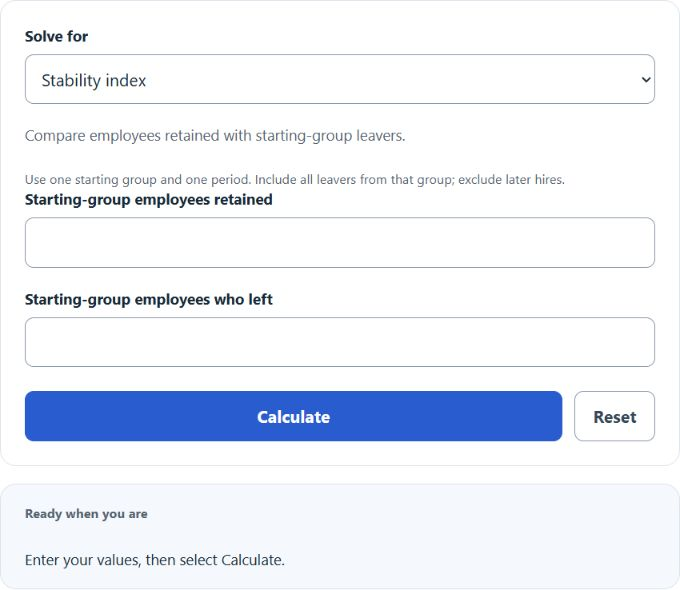
Calculate Employee Stability Index for a starting employee group, or find retained employees or starting-group leavers using an explicit solve mode.
Related Calculators
- Last Working Day Calculator
- Compa Ratio Calculator
- Benefits Effective Date Calculator
- Profit-Sharing Calculator
- All Business Calculators
Employee Stability Index Formula
The employee stability index measures what percentage of a starting group of employees remained employed through the end of a selected time period. The calculator uses the number who stayed and the number from the same starting group who left.
- ESI = employee stability index, expressed as a percentage
- NT = number of employees from the starting group still employed at the end of the time period
- NTQ = number of employees from the starting group that left during the time period
- NT + NTQ = total number of employees in the starting group used for the stability calculation
To solve for the number of employees still employed at the end, the calculator rearranges the formula as:
To solve for the number of employees from the starting group who left, the calculator uses:
If you enter NT and NTQ, the calculator returns the employee stability index. If you enter ESI and one employee count, it estimates the missing count using the rearranged formula. Select the value to solve for and enter the other two values. Input headcounts must be non-negative whole numbers, and ESI must be between 0% and 100%. All starters must be accounted for: include every departure reason and exclude later hires. Inverse estimates can be fractional when the supplied index is rounded.
Illustrative Employee Stability Index Ranges
These descriptions are illustrative, not validated industry ratings. Compare the same cohort and time period; quits-only inputs describe full retention only when no other employees left.
| Employee Stability Index | Illustrative interpretation | What to check |
|---|---|---|
| 90% through 100% | Very high stability | Confirm that the period is long enough to be meaningful. |
| 75% to below 90% | Moderate to strong stability | Review quit patterns by team, role, tenure, or location. |
| 50% to below 75% | Lower stability | Look for hiring, management, workload, or compensation issues. |
| Below 50% | High instability | Investigate why more than half of the starting group left. |
Common Time Periods for Employee Stability
| Time period | When it is useful | Important note |
|---|---|---|
| Monthly | Tracking short-term movement in high-turnover roles | Small changes can cause large percentage swings. |
| Quarterly | Reviewing staffing trends without waiting for year-end | Use the employees who were in the starting group at the beginning of the quarter. |
| Annual | Evaluating workforce stability over a full business cycle | Do not include employees hired after the start date in the starting group. |
Example Employee Stability Index Calculations
Example 1: Calculate ESI
You started the year with 120 employees. By the end of the year, 102 of those employees were still employed, and 18 from that starting group had left.
The employee stability index is 85%.
Example 2: Calculate NTQ
Your employee stability index is 80%, and 64 employees from the starting group are still employed at the end of the period.
The number of employees from the starting group who left is 16.
Employee Stability Index FAQ
What does employee stability index tell you?
Employee stability index tells you the percentage of a starting employee group that remained employed through the end of a selected period. A higher percentage means more of the original group stayed. A lower percentage means more of the original group left.
Is employee stability index the same as turnover rate?
No. Employee stability index focuses on the starting group and measures how many of those employees stayed. Turnover rate often measures separations compared with an average headcount over a period. The two metrics are related, but they are not calculated the same way.
Should new hires be included in the employee stability index?
No. New hires during the period should not be added to the starting group. The index is based on employees who were already in the group at the beginning of the period. Including new hires would distort the stability measurement.