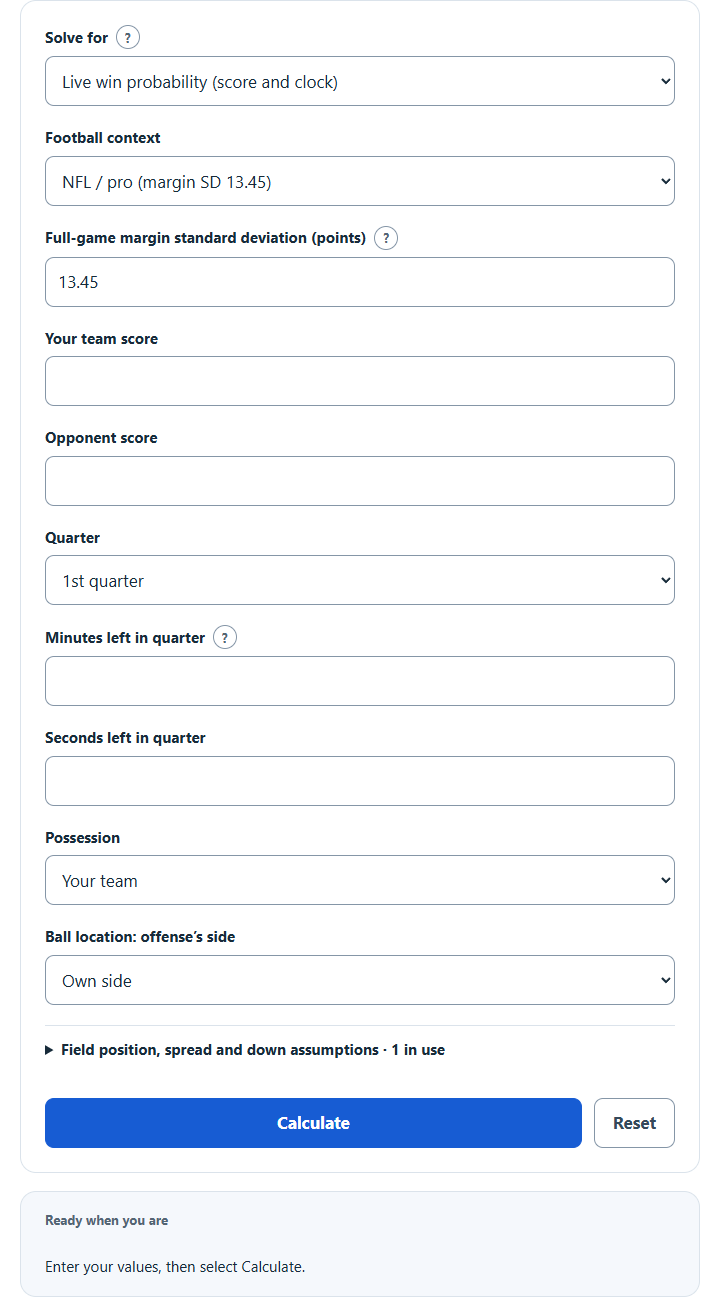
Estimate a football team’s win probability from the score, clock and possession, or before kickoff from the point spread, ratings or moneyline odds.
Football Win Probability Formula
This calculator uses a transparent American-football scoring-margin model. It does not use soccer expected goals or a Poisson goal model. The primary assumption is that the final score margin can be approximated by a normal distribution whose mean changes with the game state.
Pregame Model
When the point spread is entered from your team’s perspective, the model converts that spread to an expected final margin. A team listed at -3.5 is treated as having an expected margin of +3.5 points. The calculator starts with a full-game margin standard deviation of 13.45 points for the NFL, or about 16.5 for college; replace it with your own model’s value if you have one. The league selector provides context only.
Regulation ties are counted as half a win. The result adds the probability of a margin above +0.5 to half the probability between -0.5 and +0.5. This is expected regulation win credit, not an established eventual win probability. At zero regulation time, a lead, tie and deficit return 100, 50 and 0 percent credit respectively; a tied game has no modeled overtime outcome.
Live Game Model
Live mode starts with the current score margin. It then adds a bounded expected-points estimate for the current drive and the remaining share of the pregame expectation. The amount of future scoring uncertainty decreases with the square root of the fraction of regulation time remaining.
The drive estimate uses field position, down, distance, and expected seconds remaining in the drive. It is capped between -1.6 and 6.6 points and is intentionally a compact heuristic rather than a play-by-play model.
Lead Needed for a Target Probability
Target mode reverses the same normal-margin calculation. It finds the score margin that produces the selected win probability at the chosen time, assuming neutral possession and evenly matched teams. The threshold is rounded upward for every sign, then the forward model verifies that the whole-point margin meets the target and one point less does not. Before kickoff it is a required expected margin, not an actual score lead.
How to Use the Result
- Use live mode for score, clock, possession, field position, down, and distance.
- Use pregame mode for an illustrative normal-margin estimate from a spread or point-based ratings, or proportionally normalize two opposing American moneylines from the same two-outcome market and time. Normalization does not reveal a true probability.
- Use target mode to estimate the lead associated with a selected win probability and time remaining.
Assumptions and Limitations
- The model is an estimate and is not trained separately for every team, season, weather condition, or injury situation.
- It does not explicitly model timeouts, two-minute clock strategy, overtime rules, turnover likelihood, fourth-down choices, or team-specific pace.
- Point spreads and moneylines may contain a sportsbook margin. The no-vig option divides each implied share by their sum when both opposing prices are entered. This is proportional normalization, one assumption about margin allocation. Binary-equivalent odds and hypothetical expected value inherit the selected model and settlement assumptions.
- Small input changes late in a game can produce large probability changes because little scoring uncertainty remains.
Browse the complete Football calculator collection or return to the Sports & Fitness Calculators hub.
Sources
Calculator Academy inherited illustrative model, with corrected assumptions and regulation tie semantics. Normal-distribution reference: NIST/SEMATECH e-Handbook, Normal Distribution. Odds formulas and proportional normalization are mathematical transformations, not calibrated forecasts.