Calculate healthcare productivity percentage or clock out time from start time, billable therapy minutes, target productivity, and unpaid breaks.
- All Health and Medical Calculators
- Rehab Productivity Calculator
- Therapy Productivity Calculator
- Bed Turnover Rate Calculator
- Bed Occupancy Rate Calculator
Healthcare Productivity Formula
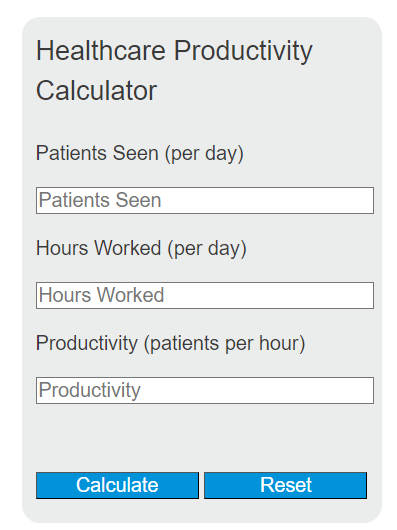
For this calculator, healthcare productivity is expressed as the number of patients seen per hour worked. It is a simple throughput metric that helps estimate provider efficiency, compare shifts, and plan staffing capacity.
- P = productivity in patients per hour
- PS = patients seen during the period measured
- HW = hours worked during the same period
If you know any two variables, you can solve for the third:
How to Calculate Healthcare Productivity
- Count the total number of patients seen during the period being measured.
- Measure the total hours worked during that same period.
- Divide patients seen by hours worked.
- Interpret the result as average patients per hour.
This metric is most useful when the time period is consistent, such as per day, per shift, per week, or per pay period.
How to Enter Values Correctly
- Keep the time period consistent. If patients are counted for one day, hours should also be for that same day.
- Use decimal hours when needed. For example, 7 hours 30 minutes should be entered as 7.5 hours.
- Define “patients seen” the same way each time. Count completed visits, encounters, or appointments consistently.
- Decide what “hours worked” means before comparing results. Some organizations use total shift hours, while others use only direct patient-care hours.
Example
If a provider sees 30 patients during an 8-hour workday, the productivity is:
That means the provider averages 3.75 patients per hour.
If that same pace is maintained over a 10-hour shift, the expected patient volume would be:
In practice, this represents an average of about 37 to 38 patients over time, depending on scheduling and rounding conventions.
What the Result Means
| Result Pattern | What It Usually Suggests |
|---|---|
| Higher patients per hour | Faster throughput, shorter visits, efficient workflows, or strong support staff coverage |
| Lower patients per hour | Longer appointment times, more complex cases, heavier documentation, procedures, or administrative tasks |
| Large swings between days | Changes in schedule design, no-show rates, case mix, staffing levels, or interruptions |
| Consistent trend over time | A better benchmark for planning than a single day’s result |
Common Factors That Affect Healthcare Productivity
- Patient complexity and acuity
- Length of appointments
- Documentation and charting time
- No-shows, cancellations, and late arrivals
- Procedures performed during visits
- Support staff availability
- Room turnover, equipment access, and clinic layout
- Time spent on phone calls, coordination, and follow-up tasks
When This Calculator Is Most Useful
- Estimating daily or weekly provider capacity
- Comparing productivity across shifts
- Monitoring changes after workflow improvements
- Projecting patient volume from expected staffing hours
- Reviewing operational efficiency for clinics, practices, or departments
Important Limitations
Patients per hour is a useful operational metric, but it does not measure everything. A higher value does not automatically mean better performance. It does not directly capture visit quality, patient outcomes, case difficulty, documentation burden, or patient satisfaction. For a more complete view, many teams review productivity alongside quality and access measures.
Tips for Better Comparisons
- Compare providers only when visit types are similar.
- Use the same definition of hours worked each time.
- Track the metric over multiple days instead of relying on one shift.
- Separate routine visits from procedure-heavy or evaluation-heavy schedules.
- Note whether support staffing changed during the measurement period.
Frequently Asked Questions
Is healthcare productivity always measured in patients per hour?
No. Some organizations use other measures such as encounters per day, billable units, or RVU-based metrics. This calculator specifically uses patients per hour.
Should breaks and lunch be included in hours worked?
Use whatever definition matches your internal reporting method. The most important rule is consistency so results remain comparable over time.
Can this formula be used for a team instead of one provider?
Yes. Add together the total patients seen by the team and divide by the team’s total hours worked for the same period.
Can I use this calculator to forecast staffing needs?
Yes. If you know the target patients per hour and expected patient volume, you can estimate the hours required using the rearranged formula for HW.