Calculate A-, C-, or Z-weighting adjustment in decibels for a frequency in Hz or kHz, or apply the adjustment to an unweighted sound level.
Quick overview: Hz to dB weighting
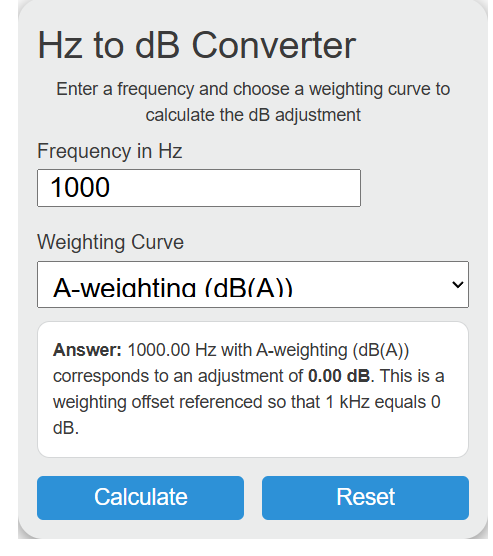
Frequency in hertz and decibels describe different properties of sound. Hertz measures how often a wave oscillates, while decibels express level on a logarithmic scale. This converter calculates the weighting adjustment applied by a sound level meter at the selected frequency.
- At 1,000 Hz, A, C, and Z weighting are defined as 0 dB.
- At 100 Hz, A-weighting is approximately -19.1 dB.
- At 4,000 Hz, A-weighting is approximately +1.0 dB.
- Z-weighting is flat and stays at 0 dB across all frequencies.
These weighting curves are defined in IEC 61672-1 and are commonly used in acoustic measurements, environmental noise studies, and occupational sound exposure analysis.
- Rms To Peak Calculator
- Feet To Milliseconds Calculator
- Length To Frequency Calculator
- Ohms To Henries Calculator
- All Unit Converters
Hz to dB Formula
Frequency in hertz and level in decibels describe fundamentally different properties of sound. Hertz measures how many pressure oscillations occur per second, while decibels quantify the magnitude of those oscillations relative to a reference. The relationship between the two only becomes meaningful when a frequency-weighting filter is applied, reshaping the raw measurement to reflect how the human auditory system perceives loudness at each frequency.
The decibel is a dimensionless ratio expressed on a logarithmic scale. For amplitude quantities such as voltage or pressure, the formula is shown below.
For this converter, the useful relationship is the frequency-dependent weighting adjustment applied by the selected curve.
Where:
- LdB is the sound level in decibels
- A is the measured amplitude
- Aref is the reference amplitude
- ΔL is the weighting adjustment in decibels
- W(f) is the weighting function at frequency f
Because the decibel is always a ratio, a standalone frequency in Hz cannot be directly converted into dB without additional context. What this converter computes is the gain or attenuation of A-weighting, C-weighting, or Z-weighting at the frequency you enter, normalized so that the output equals 0 dB at 1,000 Hz.
What is Hz to dB Weighting?
Hz to dB weighting is the process of determining how much a sound level meter increases or decreases the measured level of a tone based on its frequency. Weighting curves were created because the human ear does not respond equally to all frequencies. At moderate sound levels, the ear is much less sensitive to deep bass and very high treble than it is to midrange frequencies around 1 kHz to 5 kHz.
A-weighting is commonly used for environmental noise, workplace noise exposure, and product sound ratings. C-weighting is flatter and is often used for peak sound pressure and low-frequency analysis. Z-weighting applies no filtering at all and leaves the signal unchanged.
How to Use the Hz to dB Converter
The following steps outline how to calculate the weighting adjustment from a frequency value.
- Enter the sound frequency in hertz (Hz).
- Select the desired weighting curve: A-weighting, C-weighting, or Z-weighting.
- Click Calculate to determine the decibel adjustment applied at that frequency.
- Interpret the result as a weighting offset, not as an absolute sound pressure level.
Example Problem:
Use the following values as an example test of the calculator.
Frequency = 100 Hz
Weighting Curve = A-weighting
Result ≈ -19.1 dB
Complete 1/3-Octave Band Weighting Table
The table below lists the A-weighting and C-weighting adjustments in dB at standard 1/3-octave center frequencies from 10 Hz to 20,000 Hz per IEC 61672-1. Z-weighting is 0.0 dB at all frequencies by definition and is omitted for clarity.
| Frequency (Hz) | A-weighting (dB) | C-weighting (dB) | A minus C (dB) |
|---|---|---|---|
| 10 | -70.4 | -14.3 | -56.1 |
| 12.5 | -63.4 | -11.2 | -52.2 |
| 16 | -56.7 | -8.5 | -48.2 |
| 20 | -50.5 | -6.2 | -44.3 |
| 25 | -44.7 | -4.4 | -40.3 |
| 31.5 | -39.4 | -3.0 | -36.4 |
| 40 | -34.6 | -2.0 | -32.6 |
| 50 | -30.2 | -1.3 | -28.9 |
| 63 | -26.2 | -0.8 | -25.4 |
| 80 | -22.5 | -0.5 | -22.0 |
| 100 | -19.1 | -0.3 | -18.8 |
| 125 | -16.1 | -0.2 | -15.9 |
| 160 | -13.4 | -0.1 | -13.3 |
| 200 | -10.9 | 0.0 | -10.9 |
| 250 | -8.6 | 0.0 | -8.6 |
| 315 | -6.6 | 0.0 | -6.6 |
| 400 | -4.8 | 0.0 | -4.8 |
| 500 | -3.2 | 0.0 | -3.2 |
| 630 | -1.9 | 0.0 | -1.9 |
| 800 | -0.8 | 0.0 | -0.8 |
| 1,000 | 0.0 | 0.0 | 0.0 |
| 1,250 | +0.6 | 0.0 | +0.6 |
| 1,600 | +1.0 | -0.1 | +1.1 |
| 2,000 | +1.2 | -0.2 | +1.4 |
| 2,500 | +1.3 | -0.3 | +1.6 |
| 3,150 | +1.2 | -0.5 | +1.7 |
| 4,000 | +1.0 | -0.8 | +1.8 |
| 5,000 | +0.5 | -1.3 | +1.8 |
| 6,300 | -0.1 | -2.0 | +1.9 |
| 8,000 | -1.1 | -3.0 | +1.9 |
| 10,000 | -2.5 | -4.4 | +1.9 |
| 12,500 | -4.3 | -6.2 | +1.9 |
| 16,000 | -6.6 | -8.5 | +1.9 |
| 20,000 | -9.3 | -11.2 | +1.9 |
The “A minus C” column shows how much more strongly A-weighting suppresses low-frequency energy compared with C-weighting. At 31.5 Hz the difference is 36.4 dB, which helps explain why deep bass can seem much less significant on a dB(A) meter than on a dB(C) meter.
Why Frequency Weighting Exists: Equal-Loudness Contours
Human hearing is not equally sensitive across the entire frequency spectrum. Research by Fletcher and Munson, later refined and standardized in ISO 226, produced equal-loudness contours that show how much sound pressure is required at each frequency for tones to be perceived as equally loud. These curves reveal that the ear is most sensitive in the midrange and much less sensitive at very low frequencies, especially at low listening levels.
A-weighting was developed as an approximation of the 40-phon contour and is best suited to moderate sound levels. C-weighting approximates a much flatter high-level contour. Z-weighting applies no shaping and is used when raw unweighted data is needed.
When to Use A-Weighting, C-Weighting, or Z-Weighting
Choosing the correct weighting curve depends on what you are measuring and which standard or regulation applies.
| Weighting | Typical Use Cases | Regulatory Examples |
|---|---|---|
| A-weighting dB(A) | General environmental noise, workplace noise exposure, community noise limits, product noise ratings | OSHA 29 CFR 1910.95, EU Directive 2003/10/EC, WHO noise guidelines |
| C-weighting dB(C) | Peak sound pressure measurement, low-frequency noise analysis, hearing protector evaluation | EU Directive 2003/10/EC peak limit, venue sound monitoring, low-frequency assessment |
| Z-weighting dB(Z) | Unweighted spectral analysis, engineering measurements, octave-band data collection | IEC 61672-1 reference mode for flat response |
A useful rule of thumb is that if the difference between dB(C) and dB(A) exceeds about 10 dB, the sound likely contains substantial low-frequency energy.
dB(A) Levels of Common Sound Sources
To place weighted sound levels into context, the table below shows approximate A-weighted levels for common environments and events.
| Sound Source | Level dB(A) | Perception / Notes |
|---|---|---|
| Threshold of hearing | 0 | Reference level for human hearing at 1 kHz |
| Quiet rural area at night | 20 - 25 | Barely perceptible background |
| Whisper at 1 m | 30 | Very quiet |
| Residential living room | 35 - 40 | Comfortable indoor background |
| Office / library | 40 - 50 | Moderate quiet |
| Normal conversation at 1 m | 55 - 65 | Moderate |
| Vacuum cleaner at 1 m | 70 - 75 | Intrusive; speech must be raised |
| Busy urban traffic | 78 - 85 | Approaching hazard threshold for prolonged exposure |
| NIOSH recommended exposure limit (8 hr) | 85 | Hearing damage risk begins with sustained exposure |
| Lawn mower / food blender | 85 - 90 | Hearing protection advised |
| Motorcycle at 7 m | 88 - 95 | Loud |
| Power drill / circular saw | 95 - 100 | Very loud; safe exposure under 15 min/day |
| Nightclub / rock concert | 100 - 115 | Pain threshold begins near 120 dB(A) |
| Jet takeoff at 300 m | 120 - 130 | Immediate risk of hearing damage |
NIOSH Permissible Exposure Time by dB(A) Level
The National Institute for Occupational Safety and Health uses a 3 dB exchange rate, which means every 3 dB increase halves the safe exposure time. OSHA uses a more lenient 5 dB exchange rate. The table below compares both approaches.
| dB(A) Level | NIOSH REL (3 dB exchange) | OSHA PEL (5 dB exchange) |
|---|---|---|
| 85 | 8 hours | 16 hours |
| 88 | 4 hours | 10.6 hours |
| 90 | 2.5 hours | 8 hours |
| 91 | 2 hours | 6.9 hours |
| 94 | 1 hour | 4.6 hours |
| 97 | 30 min | 3 hours |
| 100 | 15 min | 2 hours |
| 103 | 7.5 min | 1.3 hours |
| 106 | 3.7 min | 52 min |
| 109 | 112 sec | 35 min |
| 112 | 56 sec | 23 min |
| 115 | 28 sec | 15 min |
These limits are based specifically on A-weighted measurements because occupational noise regulations generally require dB(A) as the reporting unit.
dB-Hz vs. dB(A): A Common Source of Confusion
The notation dB-Hz or dBHz represents a bandwidth expressed on a logarithmic scale using the formula 10 × log10(bandwidth in Hz). It is commonly used in radio-frequency engineering and communications. It is not the same as the weighting adjustment calculated by this converter. In other words, dB-Hz describes bandwidth, while dB(A), dB(C), and dB(Z) describe how a sound level meter weights frequencies.
Historical Weighting Curves: B-Weighting and D-Weighting
Older standards also used B-weighting, which was intended for moderate loudness levels, and D-weighting, which was developed for aircraft noise. B-weighting has largely disappeared because A-weighting proved adequate for most practical applications. D-weighting survives mainly in specialized aviation contexts and has been superseded in many certification systems by more advanced noise metrics.
Practical Measurement Tips
When working with sound measurements, use a properly calibrated sound level meter that complies with IEC 61672-1. Outdoor measurements should be taken with a windscreen to reduce false low-frequency energy caused by air movement at the microphone. The meter should be calibrated before and after a measurement session using an acoustic calibrator, commonly at 94 dB or 114 dB at 1,000 Hz.
If the difference between dB(C) and dB(A) is greater than about 10 dB, the sound likely has strong low-frequency content. In that case, octave-band or 1/3-octave-band analysis measured with Z-weighting can provide a more complete picture of the frequency distribution.