Calculate the Index of Qualitative Variation (IQV) from category counts or percentages to measure how evenly values are distributed.
IQV Formula
The index of qualitative variation, or IQV, measures how evenly cases are spread across categories. The result ranges from 0 to 1. A value of 0 means all cases are in one category. A value of 1 means cases are evenly distributed across all categories.
For percentage inputs, the calculator uses:
For raw count inputs, the calculator first converts each count to a percentage:
Then it applies the same IQV formula:
- IQV = index of qualitative variation
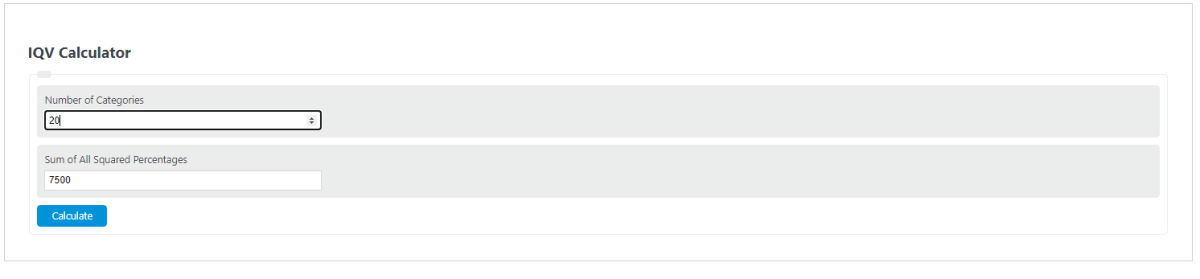
- K = number of categories
- Pct_i = percentage in category i
- Count_i = raw count in category i
- Total = sum of all category counts
- sum(Pct_i^2) = sum of the squared category percentages
The raw counts function is for frequency data, such as 45 people in one group, 30 in another, and so on. It converts the counts into percentages before calculating IQV.
The percentages function is for data already expressed as percentages. The percentages should add to about 100. If they are noticeably off, the calculator normalizes them before calculating IQV.
IQV Result Interpretation
| IQV range | Interpretation | What it usually means |
|---|---|---|
| 0.0000 to 0.1999 | Very concentrated | One category, or a small number of categories, dominates. |
| 0.2000 to 0.4999 | Moderately concentrated | The distribution has some variation, but it is still uneven. |
| 0.5000 to 0.7999 | Fairly diverse | Cases are spread across categories, but not perfectly evenly. |
| 0.8000 to 1.0000 | Highly diverse | Categories are close to evenly distributed. |
Sample IQV Values by Distribution
| Category percentages | Number of categories | IQV | Pattern |
|---|---|---|---|
| 100, 0, 0, 0 | 4 | 0.0000 | No variation |
| 70, 20, 10 | 3 | 0.6900 | Uneven, but varied |
| 45, 30, 15, 10 | 4 | 0.8867 | High variation |
| 25, 25, 25, 25 | 4 | 1.0000 | Maximum variation |
IQV Examples
Example 1: Raw counts
Suppose your category counts are 45, 30, 15, and 10.
The IQV is 0.9000, which indicates a highly diverse distribution.
Example 2: Percentages
Suppose your category percentages are 70, 20, and 10.
The IQV is 0.6900, which indicates a fairly diverse distribution, but not an even one.
FAQ
What does a higher IQV mean?
A higher IQV means the cases are spread more evenly across the categories. An IQV near 1 means the categories have similar shares. An IQV near 0 means most cases are in one category.
Should you enter counts or percentages?
Enter counts if you have raw frequency data. Enter percentages if your data has already been converted to percentages. Both methods give the same result when they describe the same distribution.
Can IQV compare variables with different numbers of categories?
IQV is standardized from 0 to 1, so it is often used to compare variation across categorical variables. Still, the number and meaning of categories matter. A variable with many detailed categories may not be directly comparable to a variable with only a few broad categories.