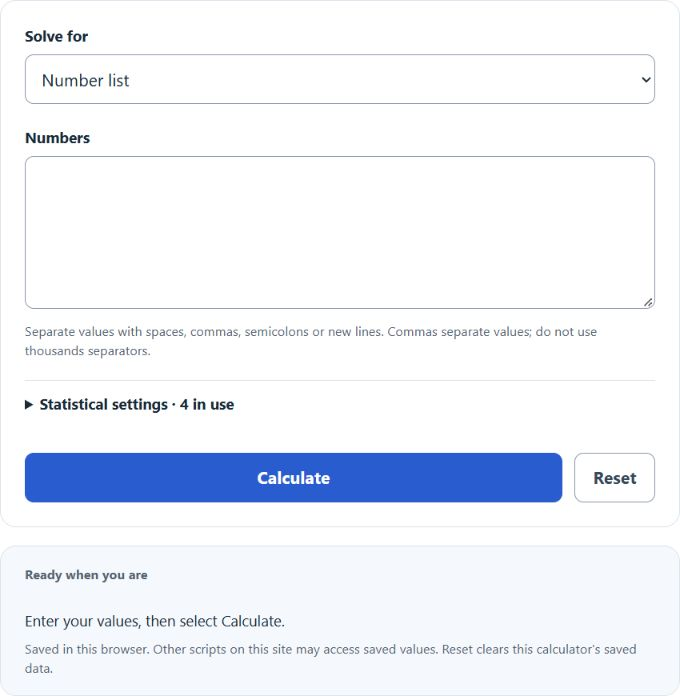
Calculate the median and summary statistics from a number list or value-frequency data, or estimate the median from grouped classes.
Median Formula
The median is the middle value of a data set after the values are sorted from smallest to largest. The formula you use depends on whether the count of values (n) is odd or even.
When n is odd, the median is the single middle value:
Median = x[(n + 1) / 2]
When n is even, the median is the average of the two middle values:
Median = (x[n / 2] + x[n / 2 + 1]) / 2
- Median = the middle value of the sorted data set
- n = the number of values in the data set
- x[k] = the value in position k after the data is sorted from smallest to largest
For number lists and value-frequency data, the calculator sorts the observations and uses the odd/even rules above. Frequency rows use value; count; optional label, one row per line. Nonnegative whole counts represent repeated observations; zero-count rows are retained but ignored statistically. Grouped rows use lower; upper; count with non-overlapping class boundaries. Their median is an estimate from uniform within-class interpolation, and their mean uses class midpoints. Statistical settings retain the exclusive or inclusive median-of-halves quartile convention, sample or population variance, and an optional linearly interpolated percentile. Sample variance requires at least two observations. Sorting is automatic.
Reading and Comparing the Median
The table below shows how the median is located for small data sets so you can check the position the calculator uses.
| Count of values (n) | Type | Middle position(s) | Median is |
|---|---|---|---|
| 5 | Odd | 3rd | The 3rd value |
| 6 | Even | 3rd and 4th | Average of the 3rd and 4th values |
| 9 | Odd | 5th | The 5th value |
| 10 | Even | 5th and 6th | Average of the 5th and 6th values |
The next table shows how the median compares to the mean for different data shapes, which helps you interpret a result.
| Data shape | Median vs mean | What it tells you |
|---|---|---|
| Symmetric | Median is about equal to the mean | Values are balanced around the center |
| Skewed right (high outliers) | Median is often less than the mean | A few large values pull the mean up |
| Skewed left (low outliers) | Median is often greater than the mean | A few small values pull the mean down |
Example Problems
Example 1: Find the median of 7, 2, 9, 4, 5. First sort the values: 2, 4, 5, 7, 9. There are 5 values, which is odd, so the median is the 3rd value. The median is 5.
Example 2: Find the median of 10, 3, 8, 1, 6, 12. First sort the values: 1, 3, 6, 8, 10, 12. There are 6 values, which is even, so the median is the average of the 3rd and 4th values, 6 and 8. The median is (6 + 8) / 2 = 7.
Frequently Asked Questions
Do I need to sort the numbers before I enter them?
No. The calculator sorts the values for you before finding the middle. You can enter the numbers in any order and still get the correct median.
What is the difference between the median and the mean?
The mean is the sum of all values divided by how many there are. The median is the middle value once the data is sorted. The median is less affected by very large or very small values, so it often gives a better sense of a typical value when the data has outliers.
Can the median be a value that is not in my data set?
Yes. When you have an even number of values, the median is the average of the two middle values, and that average may not appear in your original list. For example, the median of 2, 4, 6, 8 is (4 + 6) / 2 = 5, even though 5 is not in the data.