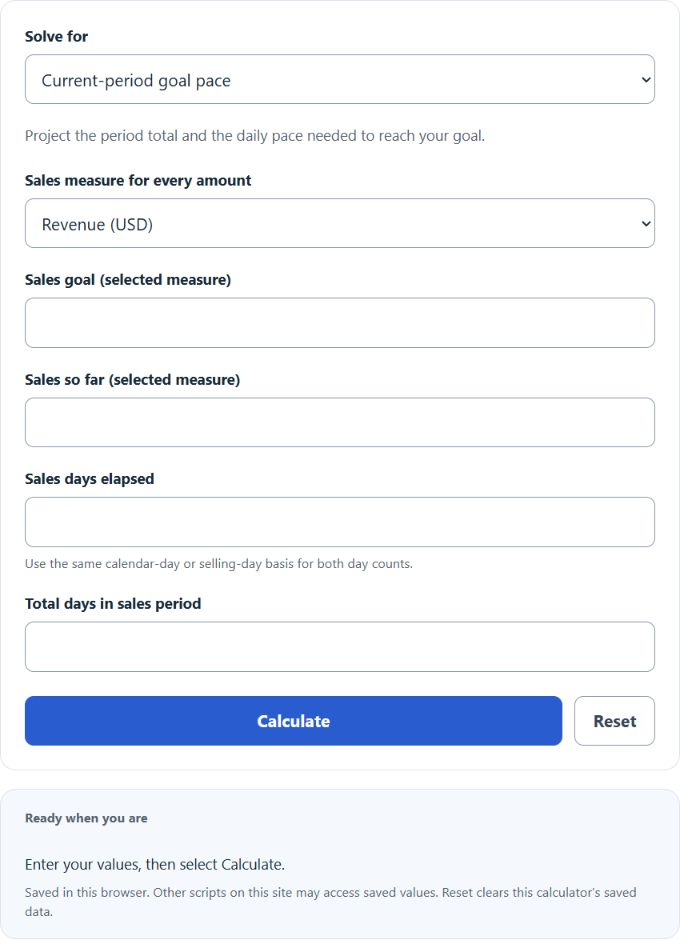
Use this Monthly Sales Pace Calculator to project month-end sales, measure goal progress, find the required remaining pace, or average sales across prior months.
Related Calculators
- Monthly Revenue Calculator
- Budget Variance Calculator
- Income Statement Calculator
- Earned Value Calculator
- All Business Calculators
Monthly Sales Pace Formula
The calculator runs in two modes. Goal Pace tracks where you stand inside the current month. Average Pace returns a monthly run rate from a longer history.
Goal Pace mode
Average Pace mode
- Goal: the monthly sales target in dollars or units.
- Sales so far: sales booked from day 1 of the period through today.
- Days elapsed: calendar or selling days completed in the period; use the same basis for both day counts.
- Total days: length of the sales period (28, 29, 30, 31, or custom).
- Total sales: cumulative sales across the months entered.
- Number of months: the months covered by the total sales figure.
Goal Pace mode compares your current daily run rate to the required daily pace. If projected sales clear the goal, you are on pace. If they fall short, the gap shows how much extra daily volume you need. Average Pace mode flattens a longer history into a single monthly run rate, then converts that to weekly, daily, and annualized equivalents using 52 weeks and 365 days per year. These are planning averages; a simple run rate does not model seasonality.
Reference Tables
Use these tables to sanity check the numbers the calculator returns.
| Goal progress at day 10 of 30 | Status | Action |
|---|---|---|
| Below 33⅓% | Behind | Raise daily pace, review pipeline. |
| Exactly 33⅓% | On pace | Hold the current run rate. |
| Above 33⅓% | Ahead | Pull deals forward or raise the goal. |
| Monthly pace | Weekly (× 12 ÷ 52) | Daily (× 12 ÷ 365) | Annualized (× 12) |
|---|---|---|---|
| $10,000 | $2,308 | $329 | $120,000 |
| $50,000 | $11,538 | $1,644 | $600,000 |
| $100,000 | $23,077 | $3,288 | $1,200,000 |
| $250,000 | $57,692 | $8,219 | $3,000,000 |
Example Problems
Example 1: Goal Pace. Your goal is $60,000 for a 30-day month. By day 10 you have booked $15,000.
- Current daily pace = 15,000 / 10 = $1,500/day
- Projected sales = 1,500 × 30 = $45,000
- Required daily pace = (60,000 − 15,000) / (30 − 10) = $2,250/day
- Goal progress = 15,000 / 60,000 = 25%
You are behind. Daily pace needs to climb from $1,500 to $2,250 for the rest of the month.
Example 2: Average Pace. A team booked $1,440,000 over 12 months.
- Monthly pace = 1,440,000 / 12 = $120,000/month
- Weekly equivalent = 120,000 × 12 / 52 ≈ $27,692/week
- Annualized pace = 120,000 × 12 = $1,440,000/year
FAQ
Should I count weekends in days elapsed? Use calendar days if your goal is set on a calendar month. Switch to selling days (custom value in Total days) if your team only works weekdays and the goal reflects that.
Why is projected sales blank? Projection requires a positive elapsed period. Zero elapsed days produces a validation message. Use matching calendar-day or selling-day counts; fractional elapsed days are allowed. At period end, the remaining daily pace is unavailable.
Can I mix dollars and units? No. Select Revenue (USD), Units sold or Orders and enter every amount in that one measure. The calculator cannot detect a number entered in the wrong unit. Orders entered must be whole counts; projected rates may be fractional.
What does the pace gap mean? It is the difference between projected month-end sales and the goal. A negative gap means you are tracking short. A positive gap means you are tracking over.