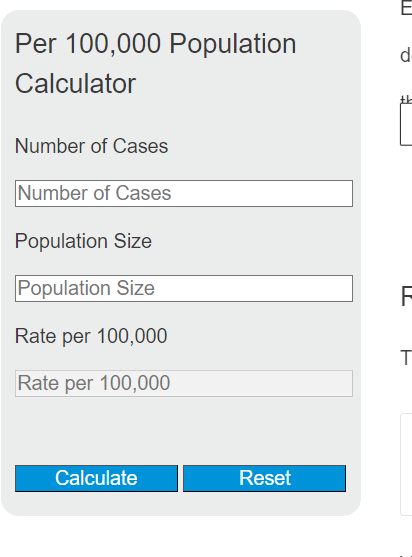
Calculate rates per 100,000 from event counts and population size, or estimate events or population from a known standardized rate.
Related Calculators
- Enrollment Rate Calculator
- Graduation Rate Calculator
- Lost Time Incident Rate Calculator
- Percentage Distribution Calculator
- All Statistics Calculators
Per 100,000 Population Formula
The calculator uses two formulas depending on which mode you select.
Cases to rate:
Rate to expected cases:
- Cases: count of events, diagnoses, deaths, or incidents observed.
- Population: number of people at risk during the same period.
- Rate Denominator: the standardization base (100,000 by default, but 1,000, 10,000, or 1,000,000 are also common).
- Known Rate: a published rate already expressed per some denominator.
- Target Population: the population you want to apply the known rate to.
The Cases to rate mode divides events by population and scales the result up to a fixed reference base so you can compare groups of different sizes. The Rate to cases mode does the reverse: it converts a known rate back into an expected number of events for a population you choose.
Reference Tables
Use these tables to sanity check your output and to pick a denominator that matches how the rate will be reported.
| Denominator | Typical use | Example |
|---|---|---|
| per 1,000 | Birth rates, infant mortality | 12 births per 1,000 |
| per 10,000 | Hospital-acquired infections | 3.5 per 10,000 patient days |
| per 100,000 | Cancer, homicide, suicide, COVID-19 | 14 deaths per 100,000 |
| per 1,000,000 | Rare disease incidence, environmental risk | 2 per 1,000,000 |
| Rate per 100,000 | Percent | 1 case per N people |
|---|---|---|
| 1 | 0.001% | 100,000 |
| 10 | 0.01% | 10,000 |
| 100 | 0.1% | 1,000 |
| 1,000 | 1% | 100 |
| 10,000 | 10% | 10 |
Examples and FAQ
Example 1: Cases to rate. A county of 245,000 people reports 37 cases of a disease in one year. Rate = (37 / 245,000) × 100,000 = 15.10 per 100,000.
Example 2: Rate to cases. The state rate is 24 per 100,000. You manage a town of 18,500 people. Expected cases = (24 / 100,000) × 18,500 = 4.44 cases.
Why standardize to 100,000? Raw counts depend on population size. A rate per 100,000 lets you compare a town of 5,000 to a city of 5,000,000 on the same scale.
Can I get a fractional case? Yes, in Rate to cases mode. The result is a statistical expectation, not a whole-person count. Round only at the very end if you need a discrete number.
What time period should I use? Cases and population must cover the same period. Most public health rates are annual. If you mix a 5-year case count with a single-year population, the rate is inflated.
Does this work for incidence and prevalence? Yes. Use new cases over the period for incidence, or existing cases at a point in time for prevalence. The arithmetic is identical.