Calculate the rate per 1,000 from event counts and population size, or find missing events or population when two values are known.
- All Unit Converters
- Population Density Calculator
- Population Growth Calculator
- GDP Growth Rate Calculator
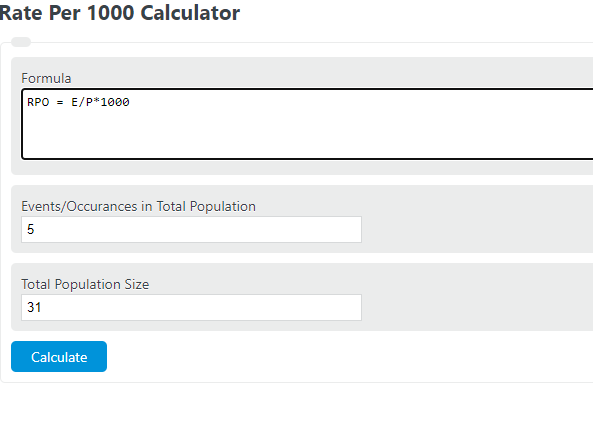
Rate Per 1000 Formula
The following formula is used to calculate a rate per 1000.
Formula source: CDC – Principles of Epidemiology, Lesson 3 (2024)
- Where RPO is the rate per one thousand
- E is the number of events or occurrences
- P is the total population or quantity
Real-World Rate Per 1000 Benchmarks
| Domain | Metric | Rate per 1,000 | Year |
|---|---|---|---|
| Demography | Global birth rate | 17.3 | 2024 |
| Demography | Global death rate | 7.6 | 2024 |
| Public Health | US infant mortality (per 1,000 live births) | 5.34 | 2024 |
| Public Health | Global infant mortality (per 1,000 live births) | 25.52 | 2024 |
| Crime | US violent crime rate | 3.74 | 2023 |
| Crime | US property crime rate | 19.17 | 2023 |
| Manufacturing | 3-sigma defect threshold | <3.0 | Industry standard |
Sources: World Bank / Macrotrends (2024), CDC NCHS (2024), FBI UCR (2023), ISM Supply Management
Rate Per 1000 Definition
A rate per 1000 is a standardized measure expressing how often an event occurs for every 1,000 units in a population or data set. It normalizes raw counts so populations of different sizes can be compared directly. The multiplier of 1,000 is conventional in demography and epidemiology when events are frequent enough that per-100,000 figures would produce unwieldy decimals, yet rare enough that a simple percentage rounds to near zero. In manufacturing, it quantifies defect density within production batches. In public health, it describes incidence or mortality within defined cohorts.
Choosing the Right Rate Base
| Multiplier | Typical Use | Example |
|---|---|---|
| Per 100 (%) | Common events in small populations | Survey response rates, pass/fail rates |
| Per 1,000 | Birth/death rates, infant mortality, crime | 17.3 births per 1,000 people (global, 2024) |
| Per 100,000 | Rare disease incidence, homicide rates | 5.6 homicides per 100,000 (US, 2022) |
| Per million (PPM) | High-precision manufacturing, Six Sigma | 3.4 defects per million at 6-sigma |
Rate Per 1000 Examples
Example 1 – Infant Mortality: A country records 1,420 infant deaths with 280,000 live births in one year. Rate = (1,420 / 280,000) x 1,000 = 5.07 deaths per 1,000 live births.
Example 2 – Manufacturing Defects: A factory produces 8,500 units and identifies 34 defects. Rate = (34 / 8,500) x 1,000 = 4.0 defects per 1,000 units. This exceeds the 3-sigma threshold of 3 per 1,000, indicating a process review is warranted.
Example 3 – Crime: A city of 450,000 reports 2,700 property crimes. Rate = (2,700 / 450,000) x 1,000 = 6.0 property crimes per 1,000 residents, well below the US national average of 19.17.
FAQ
What is the significance of calculating a rate per 1000?
It standardizes counts across populations of different sizes so a city of 50,000 and a city of 5,000,000 can be compared on equal terms. Without standardization, raw counts favor larger populations regardless of underlying frequency.
Can the rate per 1000 formula be applied to any type of data?
Yes, to any quantitative data where frequency relative to a population is meaningful: disease incidence, birth and death rates, crime, manufacturing defects, loan defaults, and employee turnover all use this metric.
How does rate per 1000 differ from a percentage?
A percentage expresses occurrences per 100. Rate per 1000 is 10 times larger numerically. Use percentages for common events; use per 1000 when the rate would be less than 1% but still meaningful at a group scale.
Why multiply by 1000 instead of 100,000?
Demographers and epidemiologists use per 1000 for moderately common events like births or deaths, where per-100,000 figures become large and harder to interpret intuitively. Per 100,000 is reserved for rarer events like specific disease incidence or homicide rates.
What is the difference between incidence rate and prevalence rate per 1000?
Incidence rate counts new events in a defined time period (e.g., new flu cases per 1,000 per week). Prevalence counts all existing cases at a point in time (e.g., diabetics per 1,000 in a population). The same formula applies; the numerator definition differs.