Calculate crime rate per 1,000, 10,000, 100,000, or 1 million residents, or solve for reported incidents or population using the standard rate formula.
- All Statistics Calculators
- Population Proportion Calculator
- Population Growth Calculator
- Rate Per 1000 Calculator
- Homicide Rate Calculator
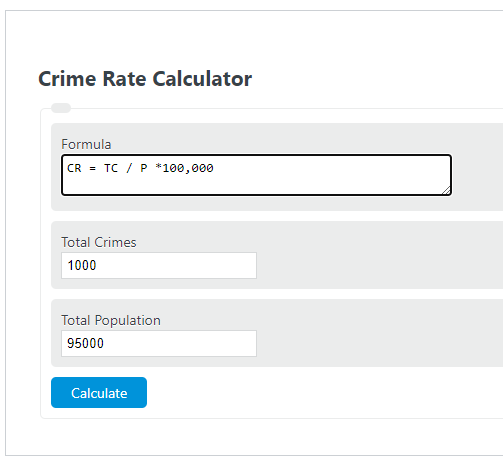
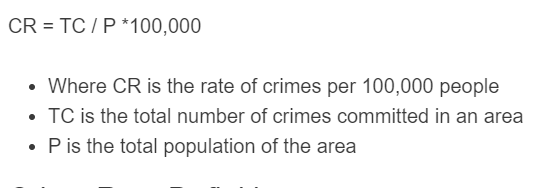
Crime Rate Formula
The calculator uses one core ratio expressed three ways depending on the mode you pick.
Crime rate mode:
Compare places mode: the same formula is applied to each place using the same rate base, then the two rates are compared.
Expected crimes mode: rearrange the formula to solve for the count.
- Reported Crimes: total offenses recorded for the period.
- Population: residents in the same area for the same period.
- Rate Base: the per-people denominator, usually 100,000, sometimes 10,000 or 1,000.
- Known Rate: a published rate you want to apply to a different population.
Assumptions: the crime count and population must cover the same area and the same time window, usually one calendar year. The figure does not adjust for unreported crimes, daytime population swings from commuters or tourists, or differences in how agencies classify offenses. Use the same crime category on both sides when comparing.
The three calculator modes match the three formulas above. The crime rate tab takes a count and a population and returns the rate at your chosen base. The compare tab runs the rate formula twice and reports which place is higher and by what percent. The expected crimes tab takes a published rate and projects an estimated count for any population you enter.
Reference Tables
The first table shows how the same incident count converts across common rate bases. The second gives a rough read on broad all-crime totals per 100,000 people.
| Crimes | Population | Per 1,000 | Per 10,000 | Per 100,000 |
|---|---|---|---|---|
| 50 | 10,000 | 5.0 | 50 | 500 |
| 250 | 25,000 | 10.0 | 100 | 1,000 |
| 1,250 | 85,000 | 14.7 | 147 | 1,471 |
| 3,500 | 120,000 | 29.2 | 292 | 2,917 |
| 12,000 | 300,000 | 40.0 | 400 | 4,000 |
| Rate per 100,000 | Rough read for all-crime totals |
|---|---|
| Under 1,000 | Low end. Common for narrow categories or small towns. |
| 1,000 to 4,000 | Moderate. Typical for many mid-size cities reporting combined property and violent crime. |
| 4,000 to 8,000 | High. Often urban areas with strong property crime reporting. |
| Over 8,000 | Very high. Verify the crime categories included before drawing conclusions. |
Worked Example and FAQ
Example 1: Single rate. A town of 85,000 reports 1,250 crimes in a year. Rate = 1,250 / 85,000 × 100,000 = 1,470.59 per 100,000 people. That is about 1.47% of residents and one report per roughly 68 residents.
Example 2: Comparing two cities. City A: 950 crimes, 72,000 people gives 1,319 per 100,000. City B: 1,280 crimes, 110,000 people gives 1,164 per 100,000. City A’s rate is about 13.4% higher than City B’s, even though City B has more total crimes.
Example 3: Estimating expected crimes. A published rate of 2,400 per 100,000 applied to a 25,000-person population gives 2,400 / 100,000 × 25,000 = 600 expected crimes for the year.
Why per 100,000? It produces whole-number rates that are easy to compare across cities of very different sizes. For small towns, per 1,000 or per 10,000 may be easier to read.
Why does my city look worse than a bigger one with more crimes? Total counts scale with population. Rates remove that effect. A small city with a high rate can have fewer incidents than a large city with a low rate.
Can I compare violent crime in one city to total crime in another? No. Match the crime categories and the reporting year, or the comparison is meaningless.
Does this predict my personal risk? No. A rate is an average across an entire population. Risk varies sharply by neighborhood, time of day, and individual circumstances.